30 Sep, 2025
 5 mins read
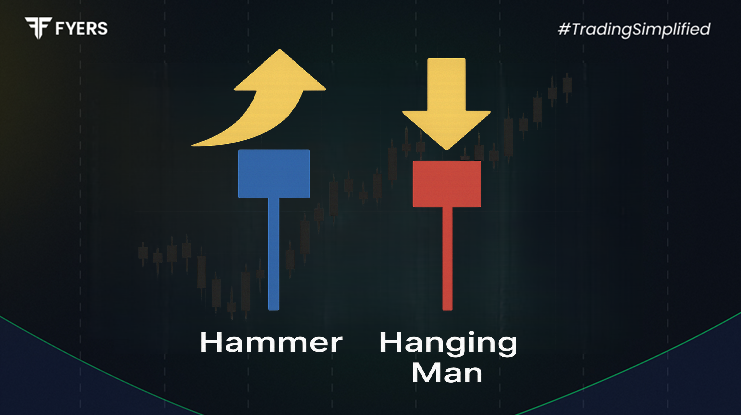
Candlestick charts are one of the most widely used tools in technical analysis. They provide traders with insights into market sentiment and possible reversals. Among the various candlestick formations, the engulfing candlestick pattern is particularly popular because of its reliability in signalling a change in trend.
In this guide, we will explain what an engulfing pattern is, its different types, how to identify and trade it, along with real-world examples and limitations every trader should know.
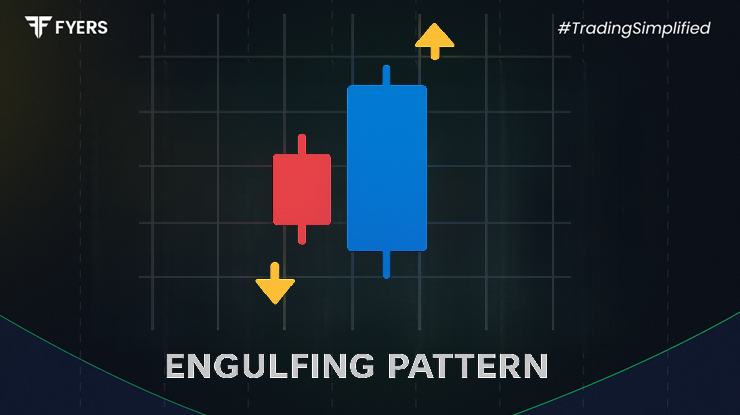
An engulfing candlestick pattern is a two-candle reversal formation that indicates a potential shift in market direction. The pattern occurs when the body of the second candle completely covers or “engulfs” the body of the first candle.
The significance lies in the sudden momentum shift. The engulfing candle shows that the prevailing trend is losing steam and the opposite side — buyers or sellers — is taking control.
Key points to remember:
It must form after a trend (uptrend or downtrend).
The second candle’s real body should completely engulf the first candle’s body, though the shadows (wicks) don’t need to be covered.
Volume confirmation strengthens the signal.
There are two main types of engulfing patterns:
Bullish Engulfing Pattern – A reversal from a downtrend to an uptrend.
Bearish Engulfing Pattern – A reversal from an uptrend to a downtrend.
These variations are mirror images of each other but provide opposite signals.
A bullish engulfing candlestick pattern forms at the end of a downtrend. It starts with a small bearish candle followed by a large bullish candle whose body entirely covers the previous candle.
Appears after a downtrend or prolonged bearish phase.
The first candle is red (bearish), and the second is green (bullish).
The second candle opens lower but closes significantly higher, showing strong buyer dominance.
The initial bearish candle reflects continued selling pressure. However, the next session’s strong buying momentum not only erases those losses but also pushes prices higher, signalling that demand is outweighing supply.
This shift often attracts traders looking to enter long positions, especially if the reversal occurs at a support zone.
The bearish engulfing pattern is the opposite. It develops at the end of an uptrend and signals a possible bearish reversal.
Occurs after a rally or extended bullish phase.
The first candle is green (bullish), followed by a larger red (bearish) candle.
The second candle opens higher but closes sharply lower, engulfing the previous body.
The strong bearish candle shows sellers overpowering buyers at higher levels. It reflects profit-taking or fresh selling pressure, suggesting the uptrend may be running out of momentum.
Traders often use this as a signal to consider short positions or tighten stop-losses on existing longs.
While the engulfing candlestick pattern can be powerful, traders usually combine it with confirmation signals before entering trades.
Identify the Pattern – Look for a clear engulfing formation after a sustained trend.
Check Volume – Higher volume on the engulfing candle increases reliability.
Look for Support/Resistance – Patterns forming at key levels have greater significance.
Confirm with Indicators – Tools like RSI, MACD, or moving averages can provide additional validation.
Set Entry and Exit Points:
For a bullish engulfing, traders may enter long above the engulfing candle’s high.
For a bearish engulfing, traders may go short below the engulfing candle’s low.
Use Stop-Loss Orders – Place stops just below the bullish engulfing candle’s low or above the bearish engulfing candle’s high.
Suppose a stock has been falling steadily for weeks. On one session, it posts a small red candle, followed by a large green candle that engulfs it. The next day, the price gaps higher with strong volume, confirming the bullish reversal.
A stock rallying for several sessions forms a small green candle, followed by a large red candle that covers the previous body. The following session continues downward, confirming the bearish reversal.
Such examples can often be observed in indices like the Nifty 50 or in heavily traded stocks where price action is clear.
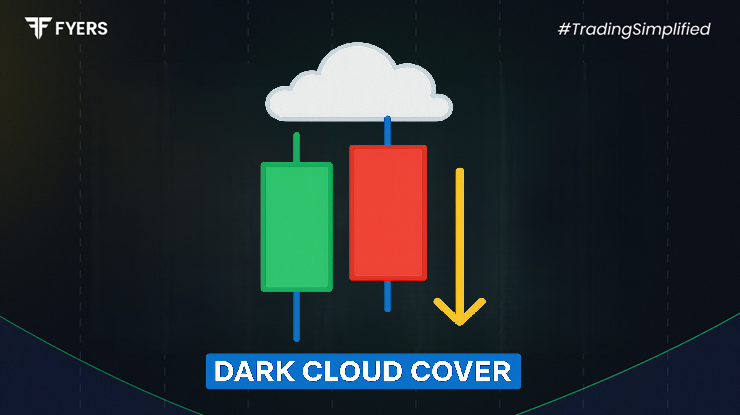
The engulfing formation is often compared with other popular reversal signals like the dark cloud cover, piercing line, or harami patterns.
Engulfing vs Harami: In a harami, the second candle is smaller and contained within the first, while in an engulfing pattern, the second candle completely covers the first.
Engulfing vs Dark Cloud Cover: Dark cloud cover is a bearish signal but only partially overlaps the prior candle, unlike the full coverage in a bearish engulfing.
Engulfing vs Piercing Line: The piercing line is a bullish signal but less powerful, as the second candle only closes above the midpoint of the previous candle, not fully engulfing it.
This makes the engulfing candlestick pattern a stronger and clearer signal than many alternatives.
Despite its popularity, the engulfing candlestick pattern has some limitations:
False Signals: In sideways or choppy markets, engulfing patterns may give misleading signals.
Confirmation Needed: Acting on the pattern without volume or follow-through increases the risk of failure.
Doesn’t Indicate Magnitude: The pattern suggests a reversal, but not how strong or long-lasting it will be.
Requires Context: Without considering overall trend, support/resistance levels, or market conditions, traders may misinterpret the signal.
Thus, engulfing patterns should be used alongside broader technical and fundamental analysis.
The engulfing candlestick pattern is a simple yet powerful reversal signal that reflects a decisive shift in market sentiment.
A bullish engulfing pattern signals the potential end of a downtrend.
A bearish engulfing pattern warns of weakness at the top of an uptrend.
By understanding the psychology behind the pattern and applying confirmation tools, traders can make better-informed decisions. However, like any technical indicator, it should not be used in isolation. Combining engulfing formations with volume analysis, support and resistance, and broader trend evaluation makes them far more effective.
It is a two-candle reversal pattern where the second candle’s body completely engulfs the first, signaling a potential trend reversal.
Neither is inherently stronger. A bullish engulfing is powerful after a strong downtrend, while a bearish engulfing is impactful after a sustained uptrend.
Yes, it can be reliable, especially when confirmed by strong volume and forming at a key support level.
There are two types: the bullish engulfing pattern and the bearish engulfing pattern.
Calculate your Net P&L after deducting all the charges like Tax, Brokerage, etc.
Find your required margin.
Calculate the average price you paid for a stock and determine your total cost.
Estimate your investment growth. Calculate potential returns on one-time investments.
Forecast your investment returns. Understand potential growth with regular contributions.
Candlestick charts are one of the most widely used tools…
30 Sep, 2025
4 mins read

You have successfully submitted your partnership request form. You will be hearing us soon!