26 Aug, 2025
 3 mins read
Candlestick charts often reveal hidden insights about market psychology, and one of the most intriguing signals is the dragonfly candlestick formation. Traders watch it closely because this pattern can indicate a potential reversal or a pause before a strong move. But what makes this signal so unique, and why do market participants pay extra attention when it shows up?
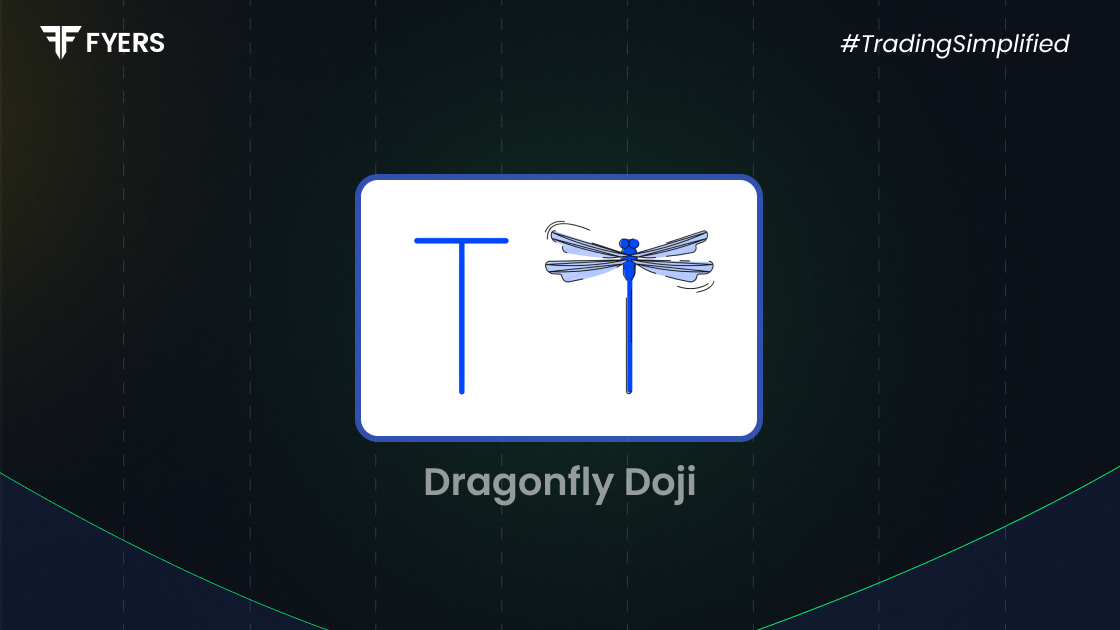
A doji candlestick forms when the opening and closing prices are almost identical, creating a cross-like structure. The dragonfly variation is characterized by a long lower shadow, little to no upper shadow, and a flat body at the top. This suggests buyers were able to recover control after significant selling pressure during the session.
To recognise this candlestick pattern, traders look for:
A long downward wick that shows sharp intraday selling.
Minimal or no upper shadow.
Closing price near or equal to the opening price.
On charts, this dragonfly formation often stands out at the bottom of a downtrend, signalling possible exhaustion of sellers.
The dragonfly candlestick hints at shifting momentum. Sellers initially push prices lower, but buyers step in aggressively to bring the price back up by the close. This tug-of-war often signals a potential trend reversal or strong support level.
While the pattern is typically seen as bullish, context matters. A bearish dragonfly may appear near resistance levels or after a prolonged uptrend, warning of weakness. Traders combine this setup with volume analysis and other indicators before deciding on entries or exits.
Although both belong to the doji candlestick family, their implications differ:
Dragonfly formation → Long lower shadow, buyers reclaim control.
Gravestone variation → Long upper shadow, sellers regain dominance.
By comparing these two, traders can better interpret whether the market is tilting bullish or bearish.
Some common strategies include:
Confirmation trading: Enter only when the next candle supports the reversal signal.
Support zone buying: Use the dragonfly signal as confirmation of a strong support level.
Stop-loss placement: Place stop-loss below the candle’s low to manage risk.
Indian markets frequently display this doji candlestick formation during high volatility. For example, when Nifty50 or large-cap stocks like Reliance and Infosys hit crucial support zones, traders often notice a dragonfly setup confirming potential rebounds.
While powerful, this signal isn’t foolproof. It can generate false breakouts in low-volume conditions. Relying solely on the dragonfly candlestick without considering broader market trends, support-resistance zones, or volume analysis may mislead traders.
The dragonfly candlestick pattern is a valuable tool in technical analysis, but it should never be used in isolation. Its real strength lies in combining it with other indicators, chart patterns, and market context. By understanding the psychology behind this doji formation, traders can make more informed decisions and reduce the risk of false signals.
It’s a type of doji candlestick with a long lower shadow and little or no upper wick, showing buyers regained control after sellers pushed prices lower.
It is generally bullish, but at resistance zones, it may act as a bearish signal.
The dragonfly has a long lower wick, while the gravestone shows a long upper wick, signalling opposite market sentiments.
Yes, it can. In an uptrend, it may hint at temporary profit booking or a possible reversal.
Calculate your Net P&L after deducting all the charges like Tax, Brokerage, etc.
Find your required margin.
Calculate the average price you paid for a stock and determine your total cost.
Estimate your investment growth. Calculate potential returns on one-time investments.
Forecast your investment returns. Understand potential growth with regular contributions.

You have successfully submitted your partnership request form. You will be hearing us soon!