25 Sep, 2025
 4 mins read
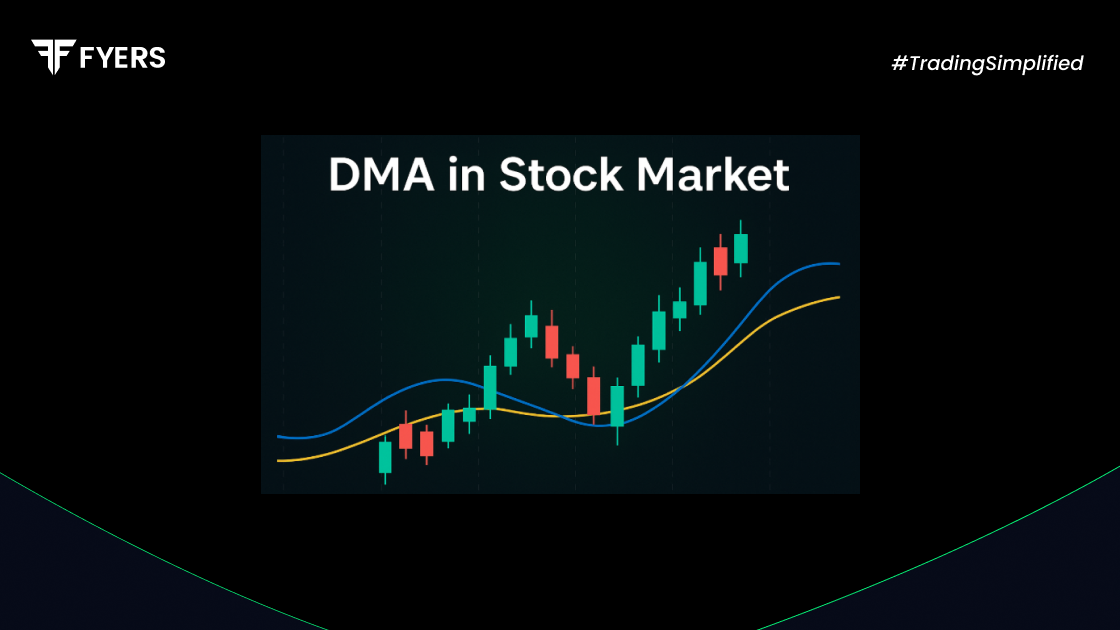
When you hear the term DMA in stock market, it might sound like just another piece of market jargon. Yet, beneath the surface lies a tool that traders lean on to cut through the noise of price charts. Imagine looking at the stock market not as chaotic squiggles on a screen, but as a pattern that can hint at tomorrow’s move. The Displaced Moving Average is one such lens, shifting the ordinary moving average just enough to give traders a different perspective. Like adjusting your stance slightly to catch the right angle of light, DMA lets you see the same data from a new position.
DMA stands for Displaced Moving Average. It is a type of moving average that has been shifted forward or backward on a chart by a set number of periods. This displacement allows traders to smoothen out the moving average and reduce the lag effect commonly seen with traditional moving averages.
For example, a 20-day DMA shifted forward by 5 days will appear ahead of the current price action. This can offer earlier trend signals compared to a standard moving average.
DMA can be applied to both Simple Moving Averages (SMA) and Exponential Moving Averages (EMA), depending on the trader’s preference.
Traders and analysts use DMA for several reasons:
Early trend spotting: By shifting the average forward, traders aim to get an earlier signal of a trend change.
Visual clarity: It helps reduce the noise of price fluctuations and provides smoother trend lines.
Improved entry and exit points: The displacement can offer better timing for trades, especially in trending markets.
Flexible customisation: Traders can adjust the number of displacement periods to suit different trading strategies.
DMA is particularly useful in identifying support and resistance levels, making it a handy tool for momentum traders.
A DMA is calculated the same way as a standard moving average. The key difference is the shifting of the plotted line by a certain number of days.
Here’s how it works:
Calculate the moving average (simple or exponential) over a selected time frame, like 10 or 20 days.
Shift the resulting line forward (positive displacement) or backward (negative displacement) by a certain number of periods.
For example:
A 20-day DMA with a +5 shift will appear 5 days ahead of the original moving average line.
A -5 shift will display the average 5 days behind.
This shift helps anticipate movements and offers a slightly leading signal, which traders find helpful in active markets.
Though both DMA and EMA are designed to smoothen price action, they serve different purposes. Here’s a comparison:
|
Feature |
DMA |
EMA |
|---|---|---|
|
Type |
Shifted SMA or EMA |
Weighted moving average |
|
Purpose |
Reduce lag and anticipate trends |
Give more weight to recent prices |
|
Displacement |
Yes |
No |
|
Reaction to price changes |
Slower, unless shifted forward |
Faster |
|
Best for |
Identifying support/resistance |
Capturing short-term changes |
Many traders use both indicators together to validate trade signals and improve timing.
While DMA offers certain advantages, it’s not without drawbacks:
Can be misleading: In sideways or volatile markets, the shift might lead to false signals.
Lag is still present: Though reduced, some lag remains, especially with longer-term DMAs.
Requires fine-tuning: The right period and displacement value can vary by stock or market condition.
No predictive power: Like all moving averages, DMA is based on past data and doesn’t predict future movements.
Therefore, traders often use DMA alongside other indicators like RSI or MACD for confirmation.
At its heart, the DMA in stock market is less about complicating your charts and more about refining how you look at them. Picture a sailor adjusting his compass ever so slightly to align with the wind. That small shift could mean smoother sailing ahead or an early warning of rough waters. DMA works in much the same way. It may not always guarantee the perfect trade, but when paired with other tools and a disciplined strategy, it can give traders just the edge they need in navigating the uncertainty of markets.
DMA stands for Displaced Moving Average. It is a moving average line that has been shifted forward or backward by a few periods to help traders see market trends more clearly and identify potential trade signals.
DMA is not necessarily better but offers different insights. While it reduces lag and helps in early trend detection, it may also give false signals in choppy markets. Many traders use it with standard averages for a fuller view.
DMA can be used in various markets, including stocks, commodities, and forex. However, it is most effective in trending conditions. In highly volatile or range-bound markets, its reliability may decrease without supporting indicators.
Calculate your Net P&L after deducting all the charges like Tax, Brokerage, etc.
Find your required margin.
Calculate the average price you paid for a stock and determine your total cost.
Estimate your investment growth. Calculate potential returns on one-time investments.
Forecast your investment returns. Understand potential growth with regular contributions.

You have successfully submitted your partnership request form. You will be hearing us soon!