30 Sep, 2025
 4 mins read
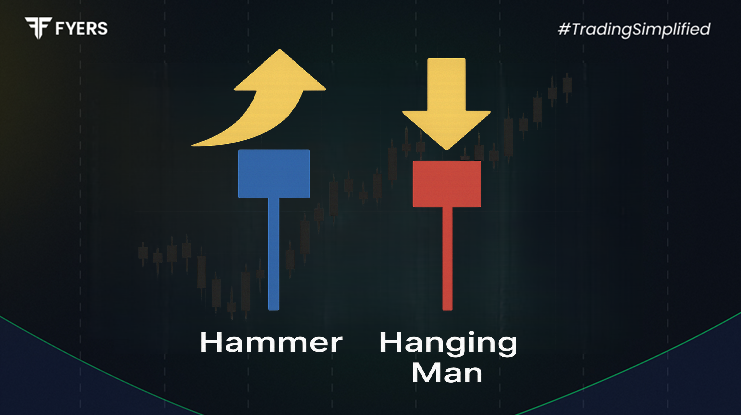
Candlestick charts are a cornerstone of technical analysis. They offer traders valuable insights into market sentiment and possible trend reversals. Two of the most recognizable single-candle formations are the hammer candlestick and the hanging man.
Although they look almost identical at first glance, their meaning changes dramatically depending on their location within a trend. Understanding the difference between hanging man and hammer is essential for anyone who wants to interpret candlestick patterns correctly and avoid costly mistakes.
A hammer candlestick is a bullish reversal signal that forms after a downtrend. It has a small real body at the upper end of the trading range and a long lower shadow, usually at least twice the length of the body. The upper shadow is either very small or absent.
The structure of the hammer shows that sellers pushed the price lower during the session, but buyers regained control and drove it back up towards the close. This shift in momentum suggests that the bearish trend could be losing strength and a potential reversal may follow.
Traders often wait for confirmation in the next candle — ideally a strong bullish move — before acting on a hammer candlestick.
The hanging man is visually similar to the hammer. It also features a small body near the top and a long lower wick. However, the key difference lies in where it appears.
The hanging man forms after an uptrend, signaling that the bullish rally might be weakening. Even though buyers managed to push prices back up by the close, the fact that sellers were strong enough to drive a significant low during the session raises caution.
This pattern reflects selling pressure building up at higher levels, and traders often look for bearish confirmation in the following sessions before making a move.
Here is the crucial difference between hanging man and hammer:
The hammer candlestick occurs at the bottom of a downtrend and suggests a bullish reversal.
The hanging man forms at the top of an uptrend and warns of a bearish reversal.
In a hammer, the recovery from intraday lows shows strong buying interest.
In a hanging man, the intraday selling pressure indicates potential weakness in the uptrend.
Traders see hammers as opportunities to enter long positions.
Hanging man candles encourage caution and possible short strategies once confirmed.
In short, the shapes are almost identical, but the location in the trend changes their meaning entirely.
Candlestick patterns are most effective when traders understand the psychology behind them.
Hammer Psychology: Sellers tried to extend the downtrend, but buyers stepped in aggressively and absorbed the supply. This creates confidence that a support level is holding, and bullish sentiment may return.
Hanging Man Psychology: After a rally, profit-taking and new selling emerge, dragging the price down. Although buyers managed to recover the losses, the selling activity signals caution and a potential reversal of the uptrend.
This difference in sentiment explains why two candles that look alike can point to opposite outcomes.
Traders don’t rely on candlestick formations alone. They integrate them with other tools to strengthen their strategies:
Look for hammers at strong support zones, moving averages, or Fibonacci retracement levels.
Wait for confirmation with higher volume or a bullish candle in the next session.
Place stop-loss orders below the hammer’s low.
Identify hanging man candles at resistance areas or near overbought conditions on indicators like RSI.
Watch for confirmation with a bearish candle or gap down the next day.
Use stop-loss just above the high of the hanging man.
By combining candlestick recognition with broader market analysis, traders reduce false signals and improve decision-making.
Hammer Example: A stock in the Nifty 50 falls for several days and then prints a hammer at a strong support zone. The next session shows a bullish breakout, confirming the hammer as a reversal signal.
Hanging Man Example: A stock rallies for weeks and then forms a hanging man near resistance. The following candle opens lower and closes bearish, signaling weakness and the start of a correction.
These examples show how hanging man vs hammer analysis plays out in real-world charts.
Although widely used, both patterns come with limitations:
They are not standalone signals and require confirmation.
False positives are common in highly volatile or sideways markets.
Their reliability increases only when combined with volume, trendlines, or technical indicators.
Context is key — without recognizing the prevailing trend, traders may misinterpret them.
Relying solely on the candle shape without considering the bigger picture can lead to errors.
The difference between hanging man and hammer lies not in their appearance but in their placement within a trend. A hammer at the end of a downtrend hints at a bullish reversal, while a hanging man at the top of an uptrend warns of possible bearish pressure.
For traders, understanding the psychology and context of these patterns is more important than memorizing shapes. By pairing them with confirmations and technical analysis tools, both the hammer candlestick and hanging man can become powerful guides in building reliable trading strategies.
Both are single-candle formations with small bodies and long lower shadows. The hammer signals bullish reversal after a downtrend, while the hanging man warns of bearish reversal after an uptrend.
The difference lies in the trend. The hammer appears at the bottom of a downtrend, while the hanging man forms at the top of an uptrend.
A hammer is a bullish reversal pattern, suggesting the end of a downtrend and possible upward movement.
Yes, the hanging man is a bearish reversal signal that indicates selling pressure is emerging at the top of an uptrend.
Calculate your Net P&L after deducting all the charges like Tax, Brokerage, etc.
Find your required margin.
Calculate the average price you paid for a stock and determine your total cost.
Estimate your investment growth. Calculate potential returns on one-time investments.
Forecast your investment returns. Understand potential growth with regular contributions.
Candlestick charts are one of the most widely used tools…
30 Sep, 2025
4 mins read

You have successfully submitted your partnership request form. You will be hearing us soon!