29 Jul, 2025
 6 mins read
Candlestick patterns are a core part of technical analysis, helping traders spot signs of potential trend reversals. One of the most widely recognised formations is the bearish engulfing pattern. This pattern often signals the shift from an uptrend to a downtrend and can be an early warning for traders.
The candlestick pattern bearish engulfing has shown up during many key market moments. During the Asian Financial Crisis in 1997, several Southeast Asian indices showed this formation before steep declines. Similarly, in May 2006, mid-cap Indian stocks displayed bearish engulfing patterns ahead of a significant drop in the Sensex. These historical examples show the value of understanding this formation.
Let us explore the bearish engulfing meaning, its importance, how to trade it, and when it is most useful.
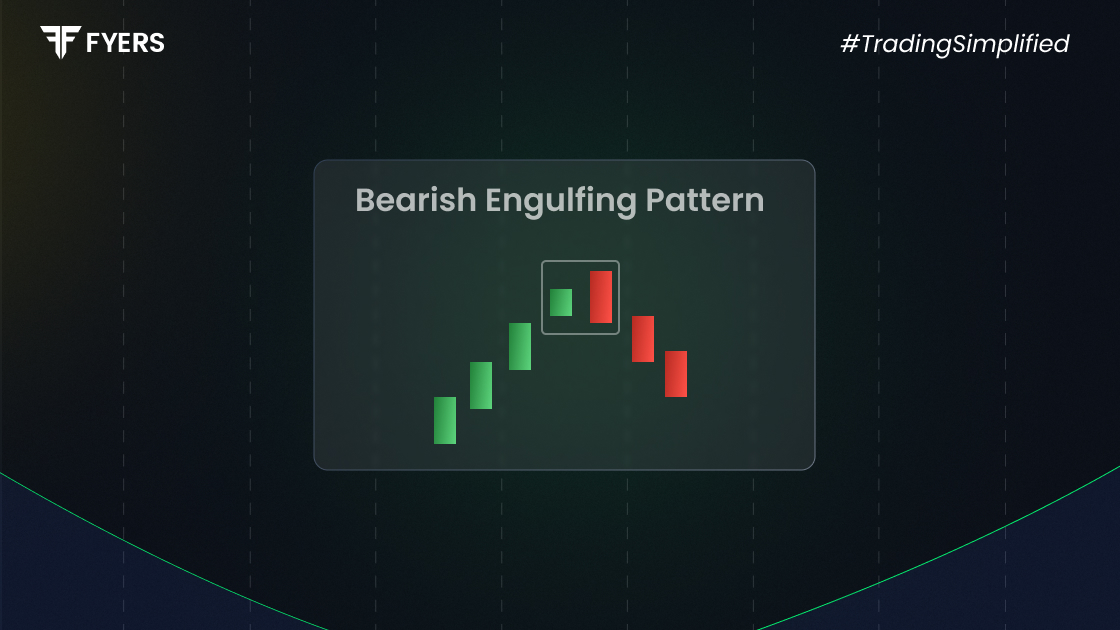
The bearish engulfing candlestick pattern is a two-candle formation that usually appears at the top of an uptrend. It signals a potential reversal to the downside.
It consists of:
A smaller bullish candle, which is usually green or white
Followed by a larger bearish candle, typically red or black, that completely engulfs the body of the previous candle
The key element here is that the second candle opens higher and closes lower than the first. This shift shows that sellers have taken control, overpowering the buyers from the previous session. The larger red candle reflects a sudden surge in bearish momentum, which can lead to a continued fall in price.
The importance of bearish engulfing pattern lies in its reliability as a reversal signal. Traders consider it a strong warning that bullish momentum is weakening. Here are a few reasons why this pattern is important:
Reversal Signal: It often marks the end of an uptrend or signals a retracement in a broader downtrend
Market Sentiment Indicator: It shows a rise in selling pressure and a possible shift towards bearish market control
Confirmation Tool: The pattern becomes more powerful when paired with technical indicators like RSI, MACD, or moving averages
Price Action Clarity: It provides clear insight into how market participants are reacting to specific price levels
Because of these factors, traders use the bearish engulfing pattern to make better decisions during uncertain market conditions.
To use the bearish engulfing candlestick pattern effectively in your trading strategy, follow these steps:
Identify the Pattern: Look for a smaller bullish candle followed by a larger bearish one that completely covers the first candle’s body
Check the Trend: Make sure the pattern forms after an uptrend or at a known resistance level
Confirm with Volume: A higher trading volume on the second candle adds strength to the signal
Set Entry Point: Traders often enter a short position just below the low of the bearish engulfing candle
Set Stop-Loss: Place your stop-loss just above the high of the bearish candle to manage risk
Set Profit Target: Use previous support levels, Fibonacci retracement zones, or a trailing stop to take profits
While this method offers a basic framework, combining it with other tools can improve its success rate.
Understanding the psychology behind this formation can help traders trust the signal more. Here is how market sentiment plays out during the bearish engulfing pattern:
First Candle (Bullish): The market is in an uptrend, and buyers continue to push prices higher
Second Candle (Bearish and Larger): Sellers step in forcefully, completely reversing the previous day’s gains and showing a loss of bullish control
This sudden reversal often signals that buyers are losing confidence, and sellers are beginning to dominate. This psychology makes the bearish engulfing meaning stronger and helps traders spot a potential downturn early.
As with any trading strategy or tool, the bearish engulfing candlestick pattern comes with both benefits and limitations.
Pros
Simple to Identify: The visual nature of the pattern makes it easy for beginners and experienced traders alike
Effective for Reversals: It works well when signalling the end of an uptrend, especially near resistance
Versatile Across Markets: The pattern is seen in stocks, Forex, commodities, and cryptocurrency markets
Cons
False Signals: Sometimes it appears during periods of market noise and does not lead to a true reversal
Needs Confirmation: It is most reliable when used with supporting indicators or higher volume
Limited Exit Clues: While it gives a clear entry signal, it does not always offer a strong idea of when to exit the trade
Because of these drawbacks, many traders choose to use the bearish engulfing pattern as part of a broader strategy rather than on its own.
Looking at some real-world scenarios helps clarify how this pattern works. Here are a few examples of bearish engulfing patterns across different markets:
Example 1: Stock Market
A stock has been rising steadily. One day, a small green candle is followed by a large red candle that completely engulfs it. The red candle also comes with higher trading volume. In the following days, the stock drops significantly, confirming the reversal.
Example 2: Forex Market
In the USD/INR currency pair, several green candles push the price higher. At a key resistance level, a bearish engulfing pattern forms. Traders notice this and take short positions. Over the next few days, the price declines sharply.
Example 3: Cryptocurrency
Bitcoin rallies to a resistance zone after a bullish trend. A bearish engulfing candlestick pattern forms at the top. With RSI showing overbought conditions, traders go short. The price drops quickly, validating the signal.
These bearish engulfing pattern examples demonstrate how powerful and consistent this signal can be when used properly.
The bearish engulfing pattern is a valuable tool in technical analysis, known for signaling potential reversals from uptrends to downtrends. Its clear visual structure and consistent behavior across various markets such as stocks, Forex, and cryptocurrencies make it popular among both beginner and experienced traders. Historical market events have shown the pattern’s reliability in anticipating downturns, reinforcing its practical relevance.
However, while the bearish engulfing candlestick can be powerful, it should not be used alone. Traders are advised to combine it with volume analysis, technical indicators like RSI or MACD, and sound risk management strategies. When used as part of a comprehensive trading approach, the bearish engulfing pattern can significantly enhance decision-making and improve trading outcomes.
Look for increased volume on the second candle or confirmation through RSI or MACD showing overbought signals.
Yes, the bearish engulfing pattern is common across all markets, including Forex and cryptocurrency.
It is considered a reliable signal, especially when it forms near resistance zones and is supported by other indicators.
The bearish engulfing pattern signals a downtrend and appears after an uptrend, while the bullish version signals an uptrend after a downtrend.
Calculate your Net P&L after deducting all the charges like Tax, Brokerage, etc.
Find your required margin.
Calculate the average price you paid for a stock and determine your total cost.
Estimate your investment growth. Calculate potential returns on one-time investments.
Forecast your investment returns. Understand potential growth with regular contributions.

You have successfully submitted your partnership request form. You will be hearing us soon!