26 Aug, 2025
 4 mins read
Technical analysis often relies on chart patterns to forecast market moves, and one of the most widely recognised formations is the ascending triangle pattern. This continuation pattern gives traders insights into potential breakouts, helping them make informed trading decisions.
In this guide, we’ll explore what the ascending triangle is, its key features, how to identify it, and how traders use triangle pattern breakouts in their strategies.
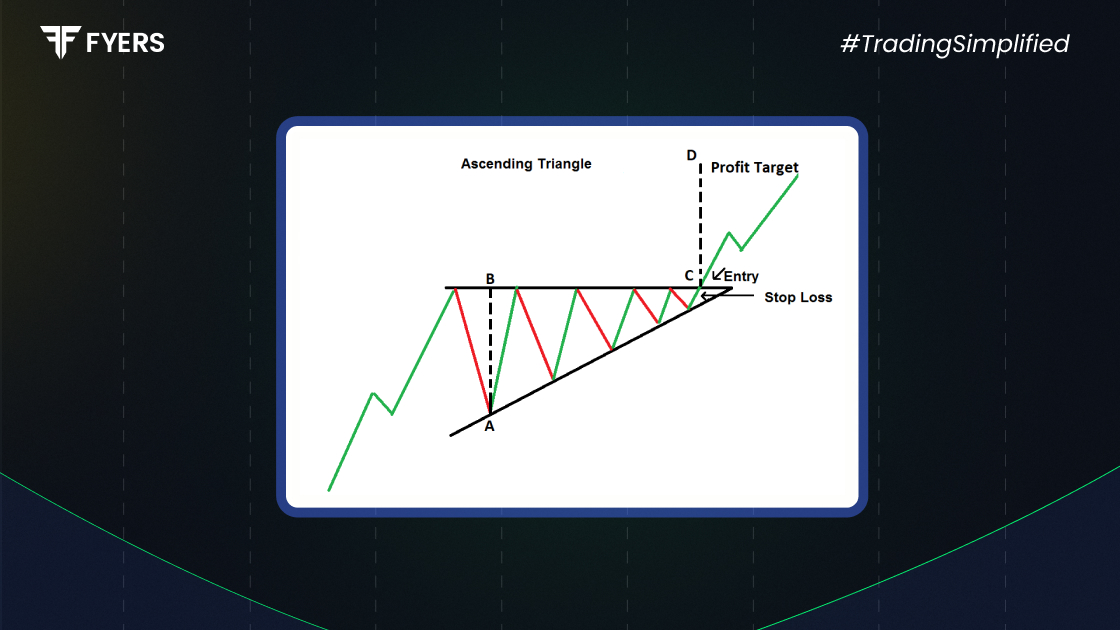
The ascending triangle pattern is a bullish continuation pattern that typically forms during an uptrend. It signals that buyers are gradually gaining strength, while sellers are unable to push prices lower beyond a certain level.
This pattern is defined by a horizontal resistance line (where the price repeatedly faces rejection) and an ascending trendline (showing higher lows as buyers step in). Together, they form a right-angled triangle pointing upwards, hence the name.
When the resistance line is eventually broken, it often triggers a triangle pattern breakout, suggesting continuation of the prior uptrend.
Some important features of the ascending triangle chart pattern include:
Horizontal Resistance: A flat line where the price struggles to break above.
Higher Lows: Each dip forms a higher low, showing increasing buying pressure.
Converging Structure: Price gradually squeezes between resistance and rising support.
Volume Decline: Trading volumes often contract within the triangle before the breakout.
Bullish Bias: While occasionally breakouts occur to the downside, the rising support usually tilts the pattern in favour of buyers.
Spotting an ascending pattern requires careful observation of price action. Here’s what to look for:
Identify a strong uptrend before the triangle begins to form.
Draw a horizontal resistance line connecting at least two highs at the same level.
Plot an ascending trendline by linking at least two higher lows.
Watch for price action narrowing between the two lines.
Confirm the structure with reducing volumes inside the triangle.
Once these conditions are met, traders prepare for a rising triangle pattern breakout.
The triangle pattern breakout is the most critical element of this formation. Traders monitor the price as it approaches the resistance line and prepare for entry once a decisive breakout occurs.
Entry Point: Traders typically enter just above the resistance level after confirmation of breakout with volume.
Stop-Loss: A stop-loss is usually placed below the ascending trendline or recent swing low.
Target Price: The expected move is often estimated by measuring the widest part of the triangle and projecting it upwards from the breakout point.
This strategy ensures that trades are backed by structure and risk management.
Here are some common strategies used by traders:
Breakout Trading: Entering positions immediately after price breaks resistance with volume.
Retest Trading: Waiting for price to retest the old resistance (now support) before entering.
Swing Trading: Combining the ascending triangle with momentum indicators like RSI or MACD to confirm strength.
Position Trading: Using the breakout for medium-term investments in trending markets.
By adapting these strategies, traders can align the ascending triangle pattern with their trading style.
High reliability in strong uptrends.
Clear entry, stop-loss, and target levels.
Works across different timeframes (intraday, swing, positional).
False breakouts may occur, leading to losses.
Requires confirmation through volume or other indicators.
Less effective in sideways or choppy markets.
Understanding both strengths and weaknesses ensures more disciplined trading decisions.
Stock Markets: Often seen in bullish stocks consolidating before making new highs.
Forex Trading: Currency pairs like EUR/USD or GBP/USD may show this structure during strong uptrends.
Crypto Markets: Bitcoin and Ethereum frequently form ascending triangles before large price surges.
In each case, traders look for triangle pattern breakout signals backed by volume to validate the move.
The ascending triangle pattern is a powerful continuation formation that signals bullish momentum. By learning to identify its structure, monitoring volume, and applying breakout strategies, traders can improve their decision-making in trending markets.
Like all chart patterns, it is not foolproof. Combining it with technical indicators, risk management, and market context is essential for consistent results.
In short, the rising triangle pattern acts as a roadmap, helping traders anticipate market moves and plan entries with greater confidence.
It is a bullish continuation pattern formed by horizontal resistance and an ascending trendline of higher lows.
It is considered reliable in strong uptrends, but traders should confirm breakouts with volume to avoid false signals.
An ascending triangle shows higher lows and signals bullishness, while a descending triangle shows lower highs and signals bearishness.
Traders typically enter after a breakout above resistance with volume, set stop-loss below the trendline, and project targets based on the triangle’s height.
Calculate your Net P&L after deducting all the charges like Tax, Brokerage, etc.
Find your required margin.
Calculate the average price you paid for a stock and determine your total cost.
Estimate your investment growth. Calculate potential returns on one-time investments.
Forecast your investment returns. Understand potential growth with regular contributions.
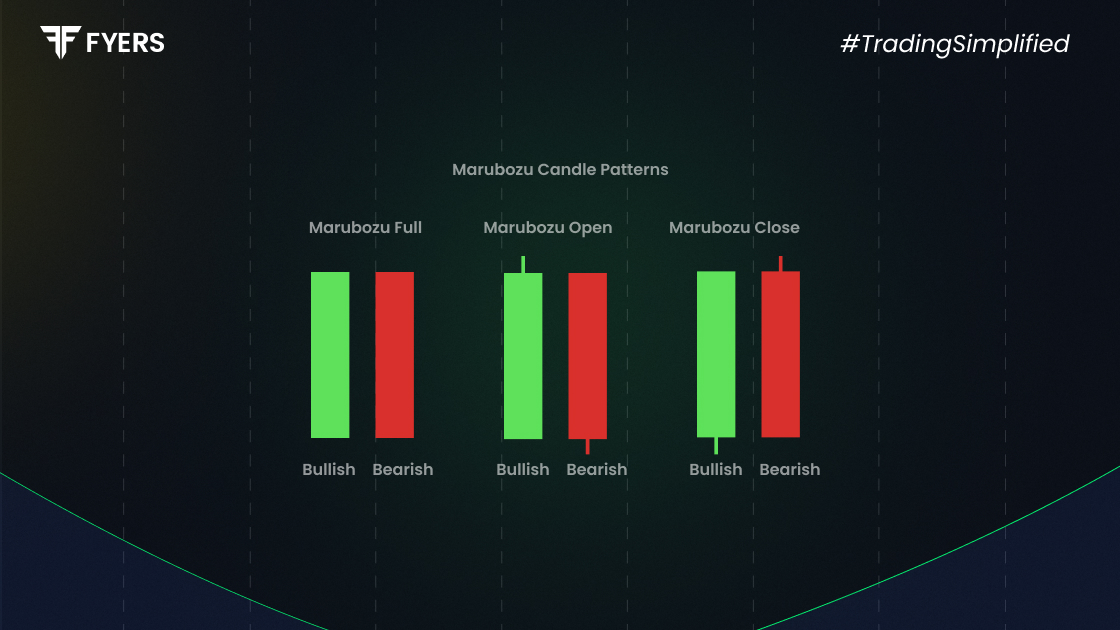
The Marubozu candlestick pattern is a simple yet powerful indicator…
20 Aug, 2025
6 mins read

You have successfully submitted your partnership request form. You will be hearing us soon!