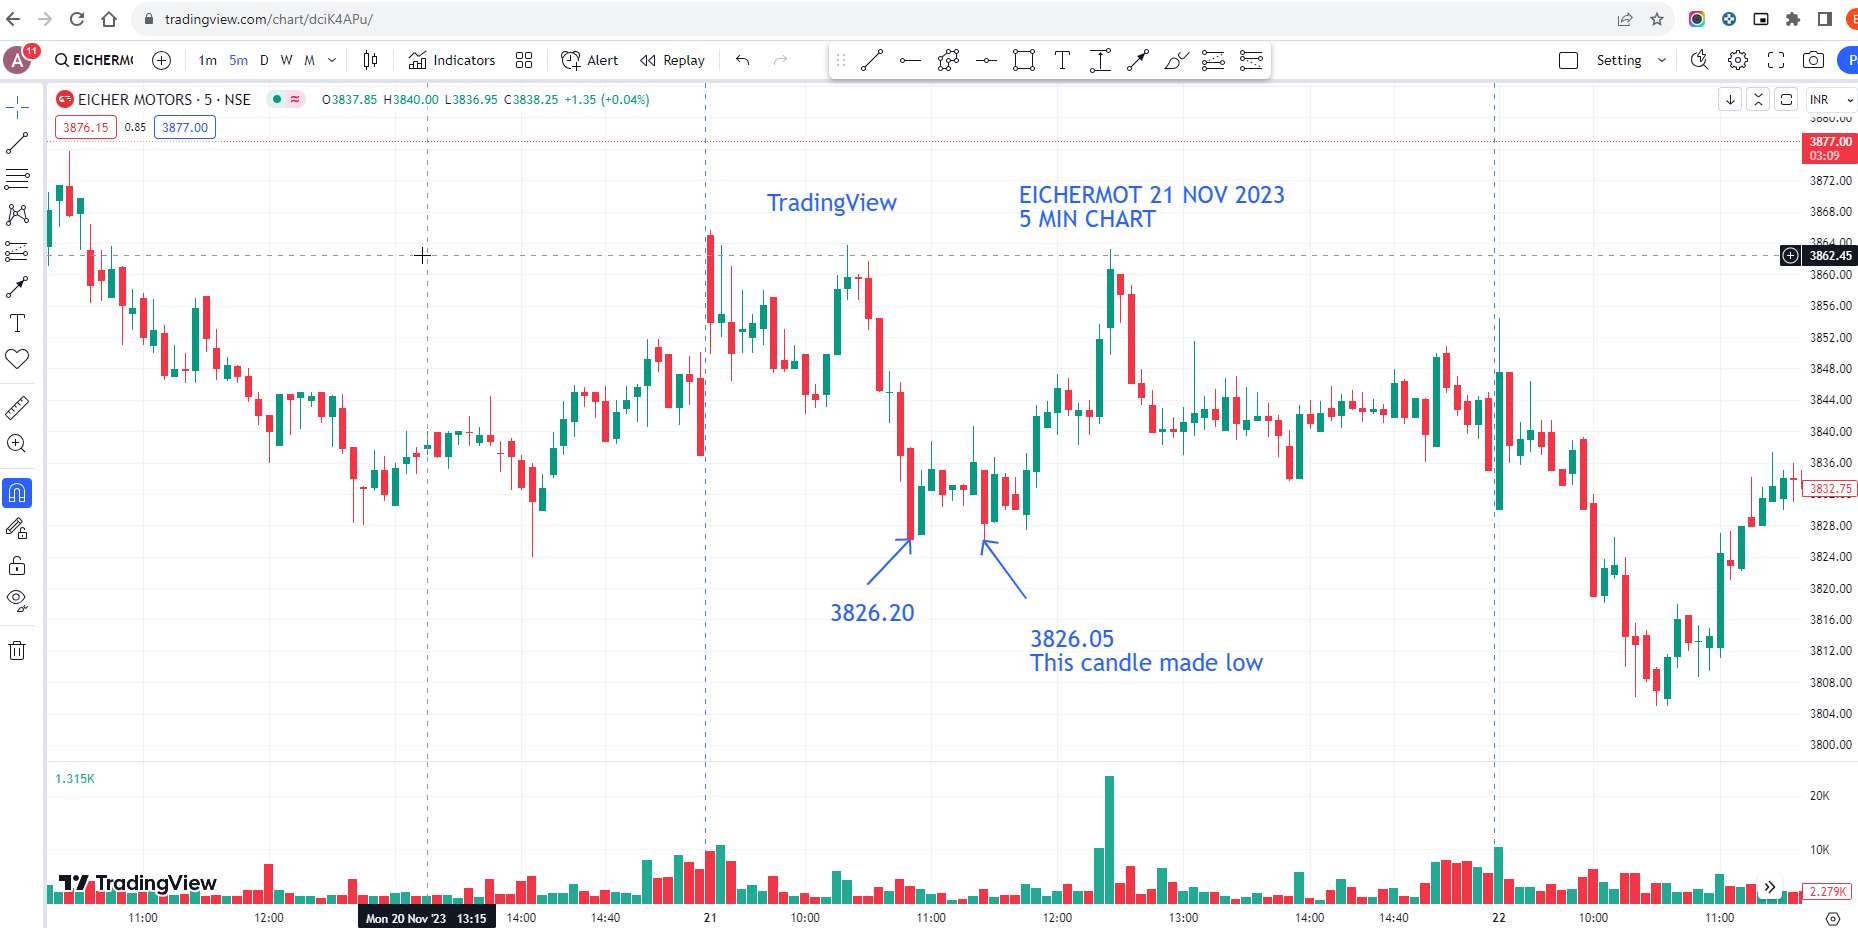
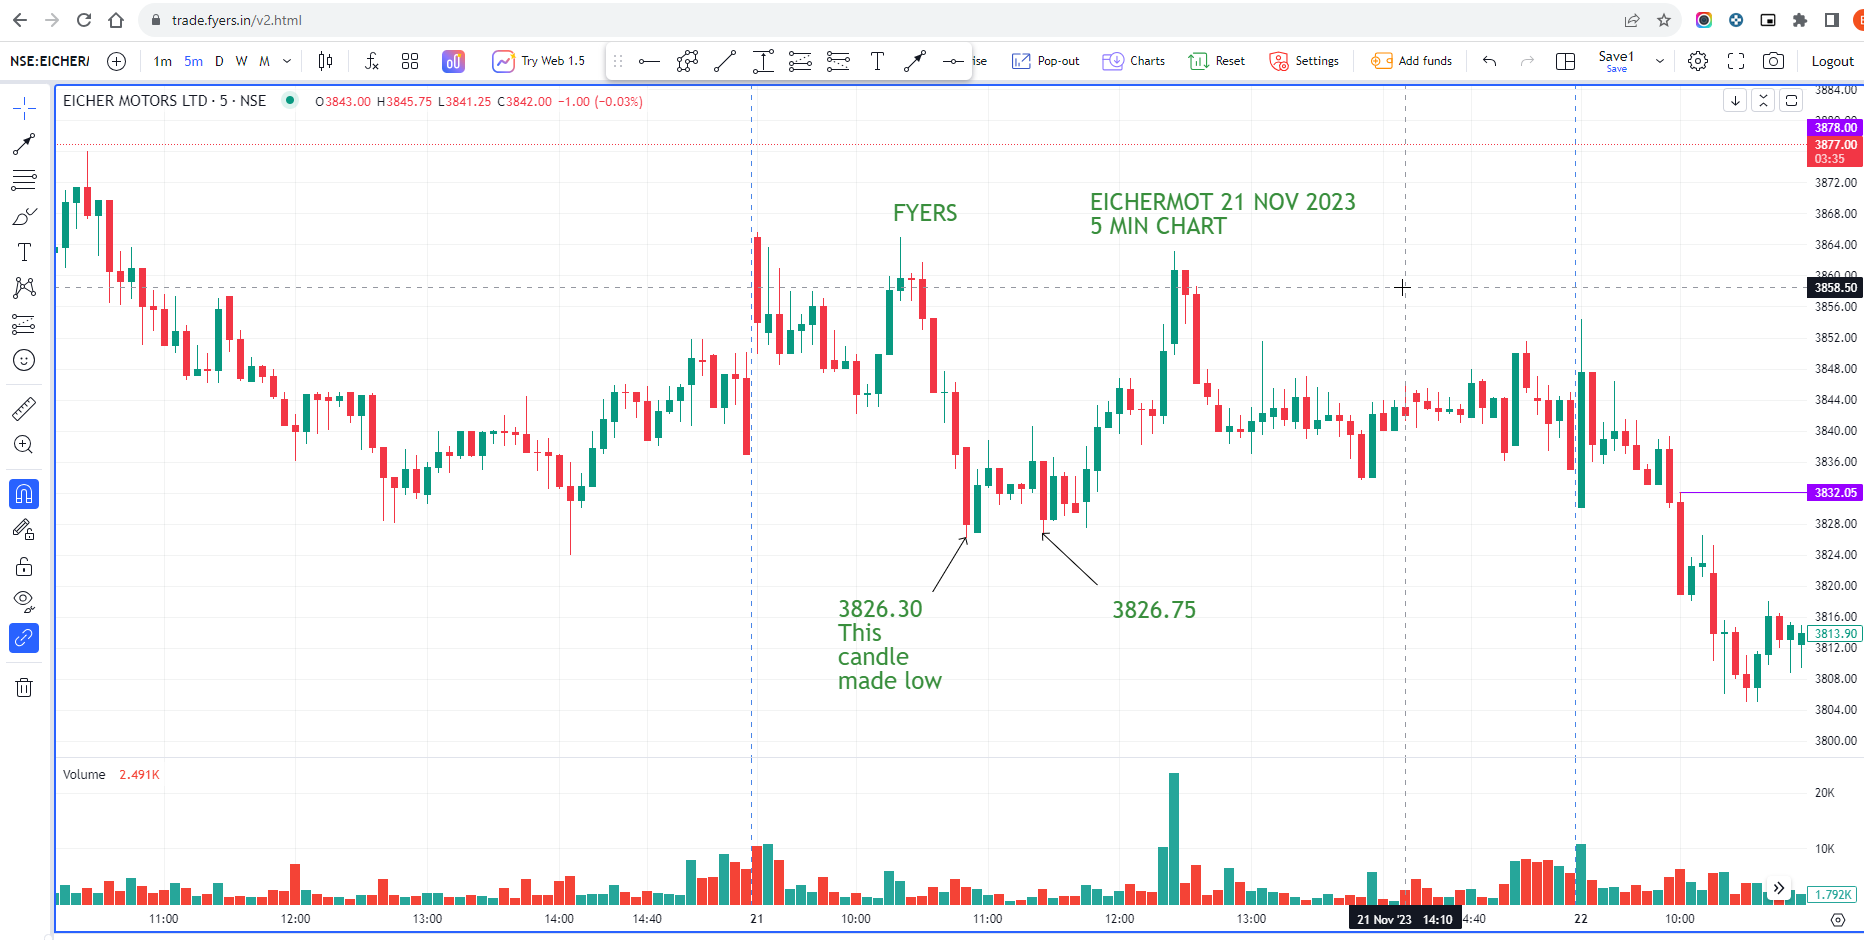
Zoom in and out issue I am experiencing some might call it a feature but it is so annoying for me and I got this when Fyers automatically shifted me to the latest version of it.
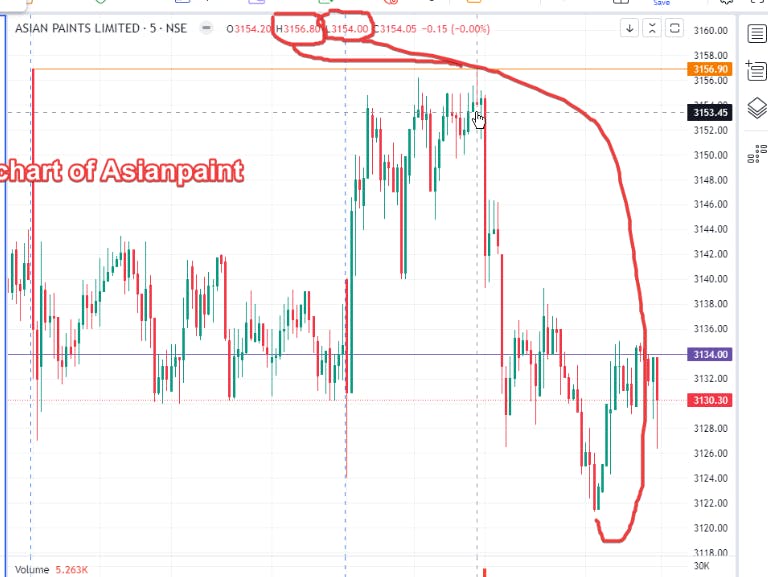
High and low are inaccurate in several charts.
Both issues evidence is attached in the post.
Please look into this and update us on what’s wrong with this.
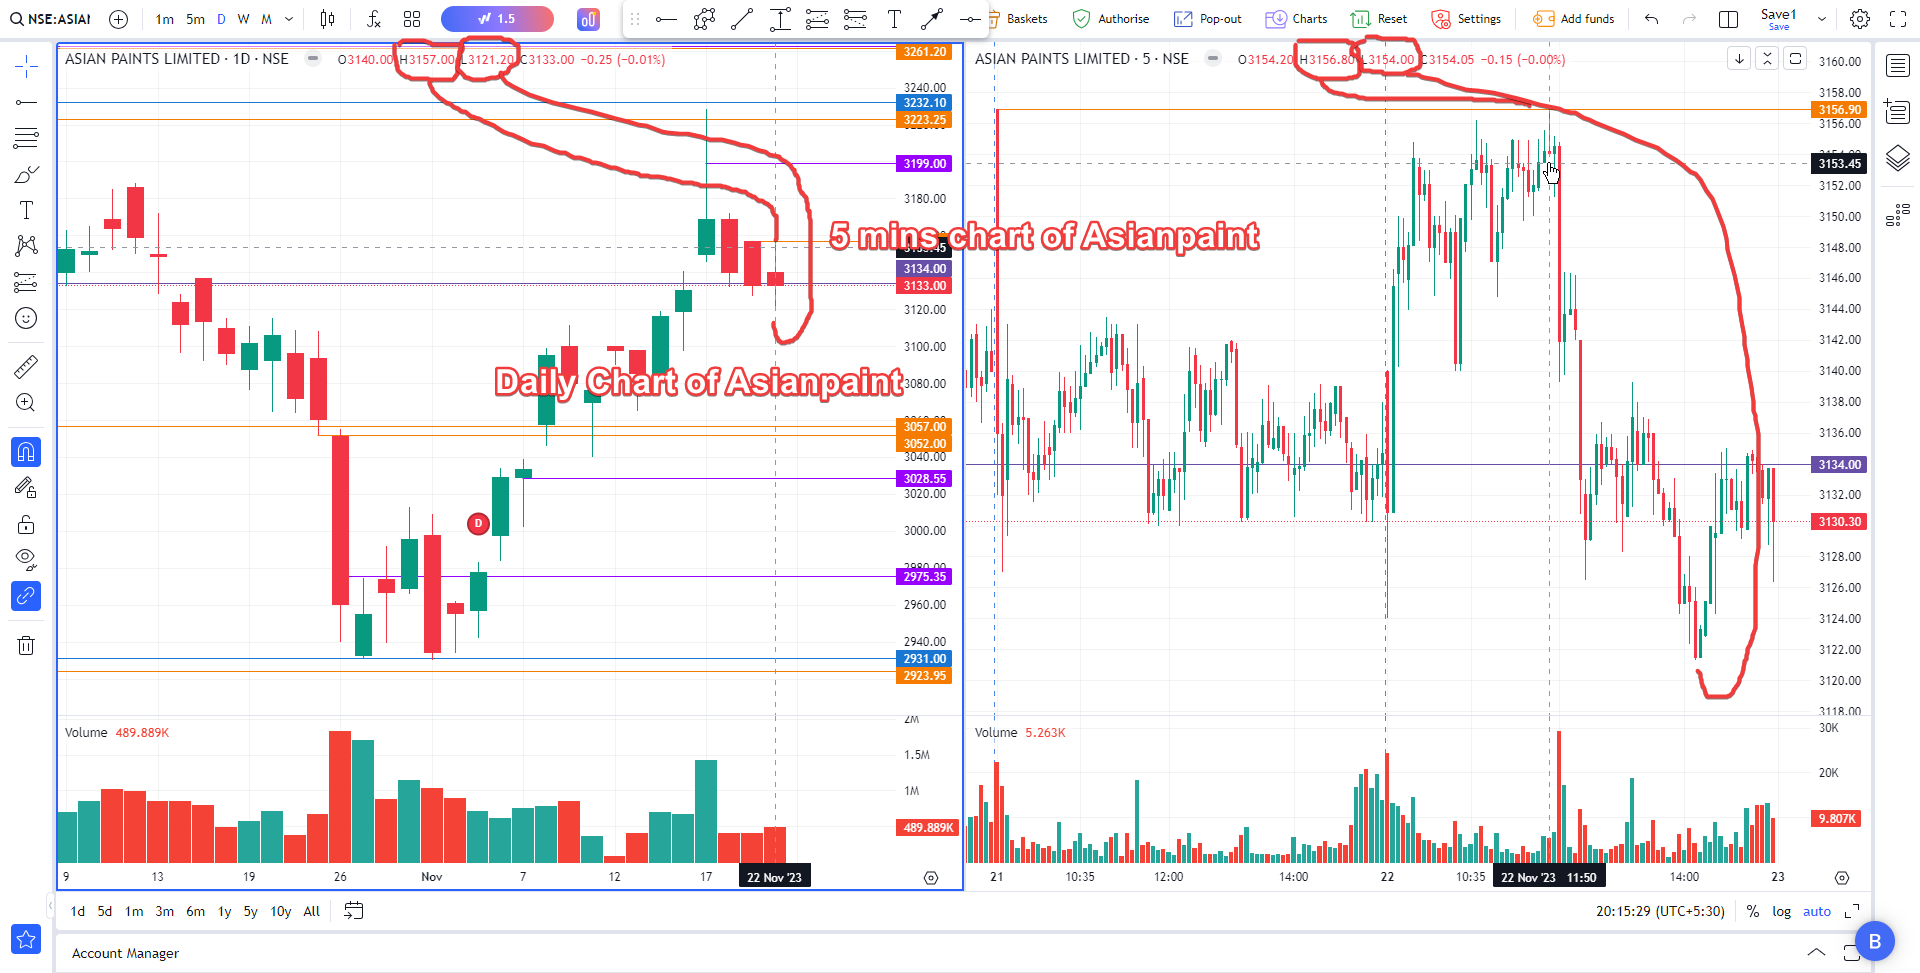
It is Data issue with Fyers OHLCV feed on IntraDay vs Daily timeframes. The same incorrect data we have on History API for 5m, 1D timeframes for ASIANPAINT 22 Nov 2023 which is causing this High-Low inconsistency on charts. TradingView.com and Zerodha Kite charts are consistent on this example.
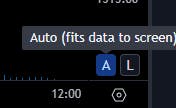
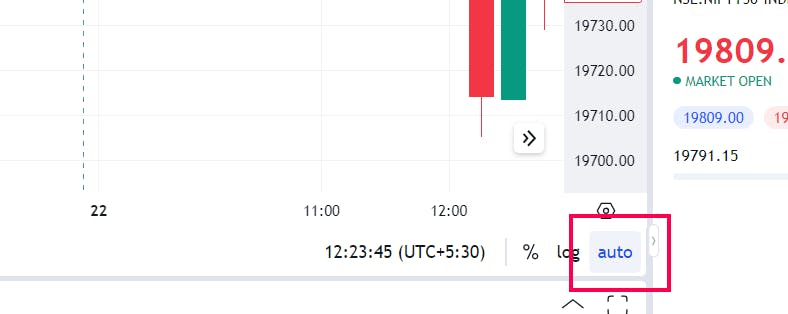
I think @communications_team needs to upgrade their TradingView Charting library to solve this Zoom issue. @chirag, AutoFit is still zooming in at center like we do with CTRL+Zoom, as compared to normal scroll zoom with native TradingView.com charts.
I dont use Web based charts, this whole concept is slightly flawed but i occasionally use it to test things
Autofit and Continous data(the problem i sorted for you) were 2 things that sorted my issues, but on some days like yest there will be data issue. Instead if one uses own charting tool then you won’t have issues.
Tools like those cost but they are packed with features.
Shruthi, I have tried but it doesn’t work if you think it works then provide some small video evidence so I and others who have this issue can resolve it.
@chirag, in Fyers (both History API as well as Web Charts)
22 Nov 2023 ASIANPAINT
5min timeframe Day Low @ 14:10 =** 3121.3**
1D timeframe Day Low =** 3121.2**
5min timeframe Day High @ 11:50 = 3156.8
1D timeframe Day High = 3157[
](http://TradingView.com)In TradingView.com and Zerodha Kite Charts,
5min and 1D Low both are consistent = 3121.2
5min and 1D High both are consistent = 3157
@communications_team, kindly do NOT disregard this data issue stating that it is working as expected. This is an issue.
@nsuyash11-m18 agreed bhai, I dont use web charts. I told you why. From last 6-7 yrs every broker has struggled and that is the nature of web browser.
But in the 5min chart, the marking is wrong so that has to be known.
If you want perfection, you charting tool like NT, AB even Falcon/fox etc and also GDFL/TD feed Back in the day everything was paid Even ticks dissipated by Exch is captured differently and same tick issue is there with every broker including Zerodha
You can check in paid Subscription of TV also. They have desktop like app with multi tab feature. (anyway, enough, i wont argue further but i have paid and used everything available)
@chirag Agree bro I just mentioned specific details so that we do not digress from the concerned core issue posted and it is not overlooked by support.
Chirag, This is the second time you have misinterpreted the data I have attached. First, Let me tell you Auto is a feature to bring the chart in Auto Mode but what I am explaining is totally different, Second there are several candles high and low are inaccurate and I have observed them every day.
I noticed you repeatedly saying that you are not using the platform then I would request you to stay away and not make it complicated and longer for others.
what you have mentioned is absolutely correct even if you may see it closely then in some cases you will find different candles for low. I have attached the screenshots of them as well, have a look at them.


 I just mentioned specific details so that we do not digress from the concerned core issue posted and it is not overlooked by support.