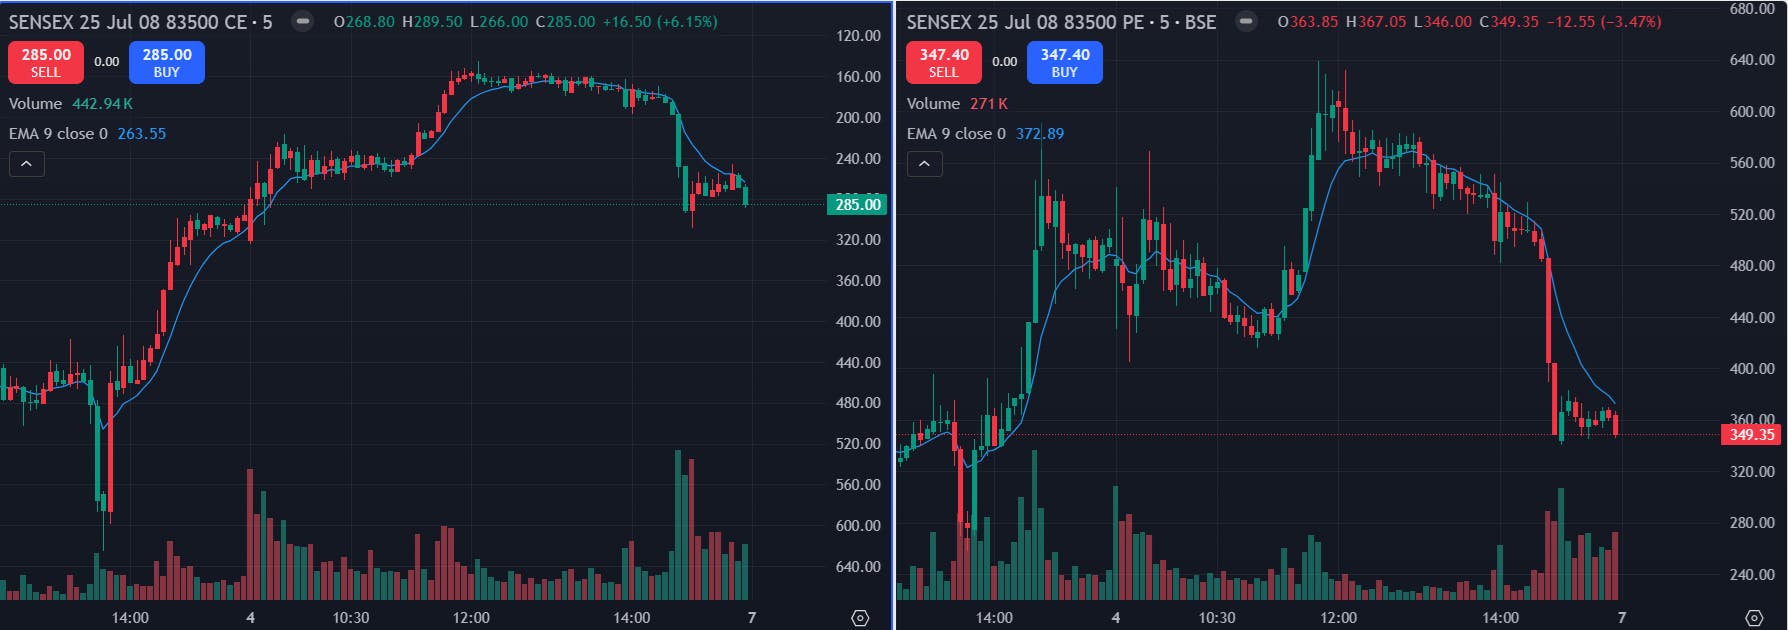
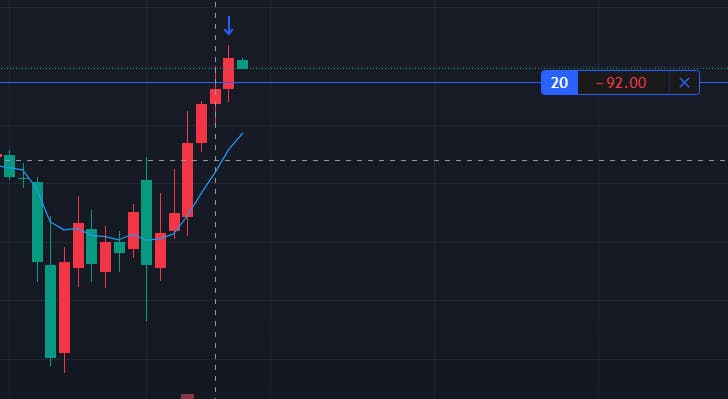
Is no one facing this ? The CE and PE going up in the below screenshot is due to wrong chart in CE, Look at how CE chart is exactly color change of PE chart and it doesn’t make sense. CE value is going up with red candles. This is only in fyers, other platforms are showing the chart correctly.
Hello @anil_franklin, could you please share your account ID via DM? A team member from the concerned department will get back to you.
Shared
Hello @anil_franklin, our team is looking into it and I will share the update with you shortly.
This is already 2 months, fyers chart is completely unusable and no action.
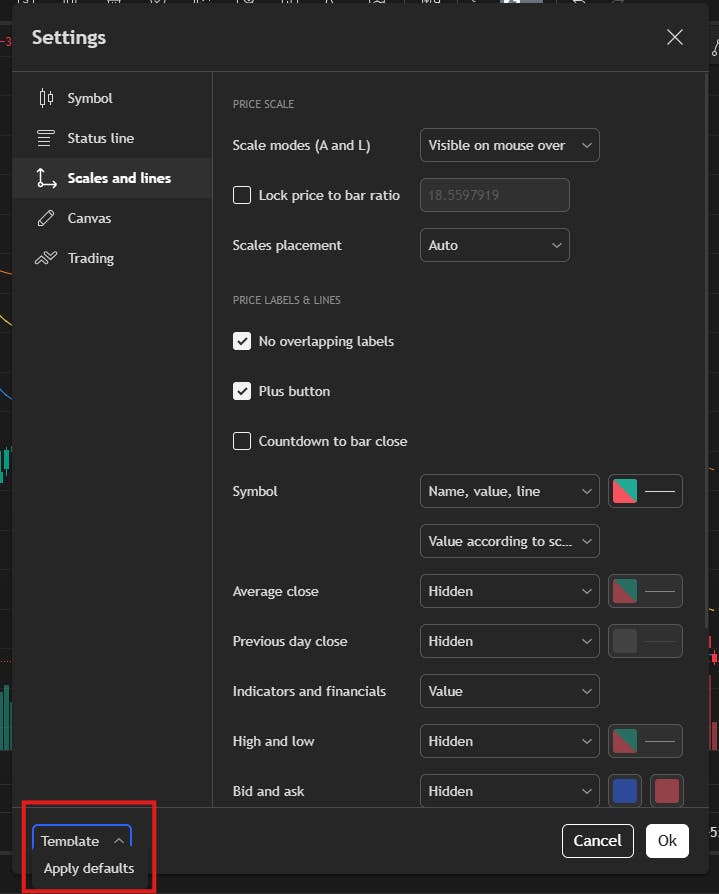
Hello @anil_franklin, could you please reset the ‘Scales and Lines’ settings to default, as shown in the screenshot below?
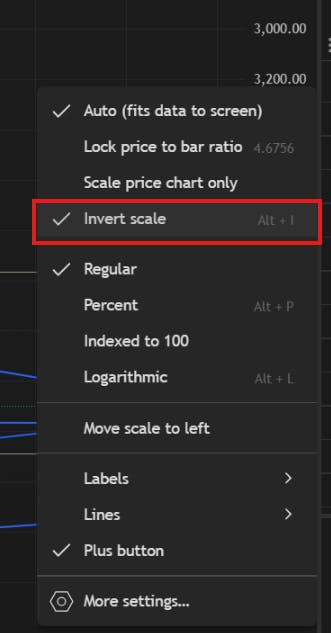
Additionally, after right clicking on the price axis on the chart if the inverted scale option is enabled, kindly click on it to disable it.
Let me know if the issue persists, I’ll be happy to assist you further.
Thanks Abhiraj, that helped!