For Options Traders, navigating the intricate maze of options trading can be thrilling yet overwhelming. The endless search for a perfect strike price, best risk-reward ratio, strategy, implied volatility, expiration date, market sentiment, and more!
Wouldn’t it be great if there’s a tool that simplifies it and takes the guesswork out of the equation?
Introducing FYERS InstaOptions: A platform simplifying, streamlining, and supercharging your options trading journey.
An InstaOptions Platform provides comprehensive and user-friendly features for option traders to analyze, strategize, and execute their trades. Whether a beginner or a seasoned trader, it can guide you to make informed and profitable decisions in the options market. In this blog post, we will show you how it can improve your trading decisions and help you trade in options like a pro.
So, let’s dive in!
What are the key features of the FYERS InstaOptions?
Combined Premium Chart
One of the challenges of options trading is to assess the potential profit or loss and risk-reward profile of your combined options positions, such as spreads, straddles, or strangles. A combined premium chart is a graphical representation of the total premium paid or received when entering a combination of options positions. This chart displays the net cost or income associated with the options strategy for different underlying assets (NIFTY, BANK NIFTY, & Stocks). With FYERS InstaOptions, you can easily create and view combined premium charts for any options positions, helping you visualize your breakeven points, maximum profit or loss, and risk-reward ratio.
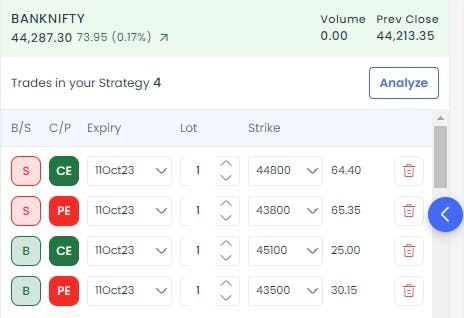
In the below example, you can see how the combined premium chart for an Iron Condor Strategy looks like :
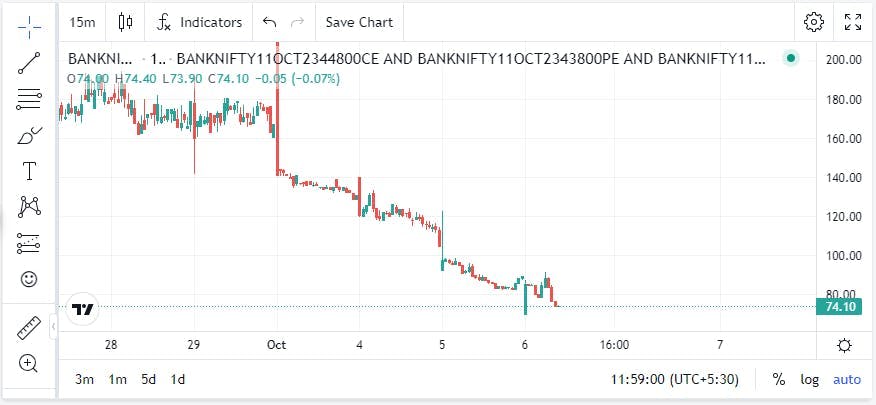
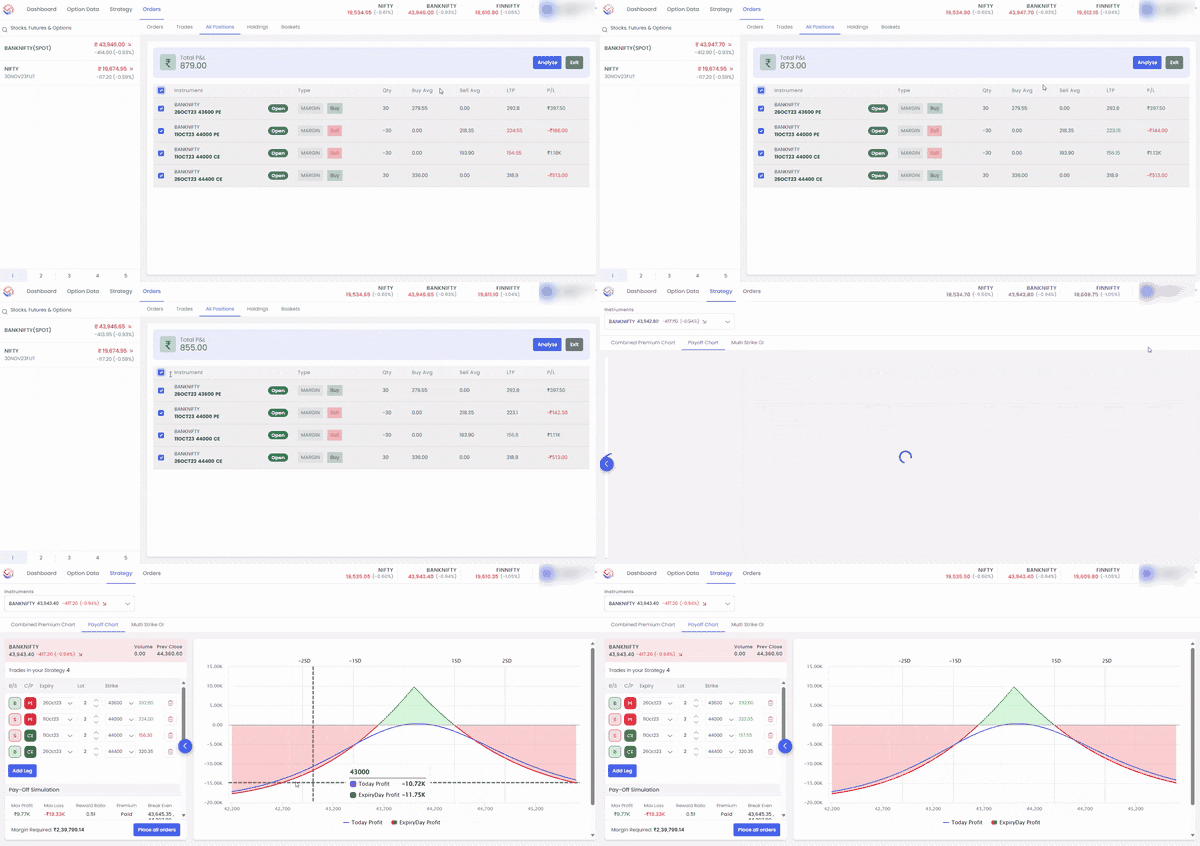
The above chart depicts the combined premium arising out of the Iron Condor strategy involving multiple strike prices and position types (Buy/Sell & CE/PE). The below screenshot showcases the positions that were taken while employing the Iron Condor strategy.
Trending OI (Open Interest)
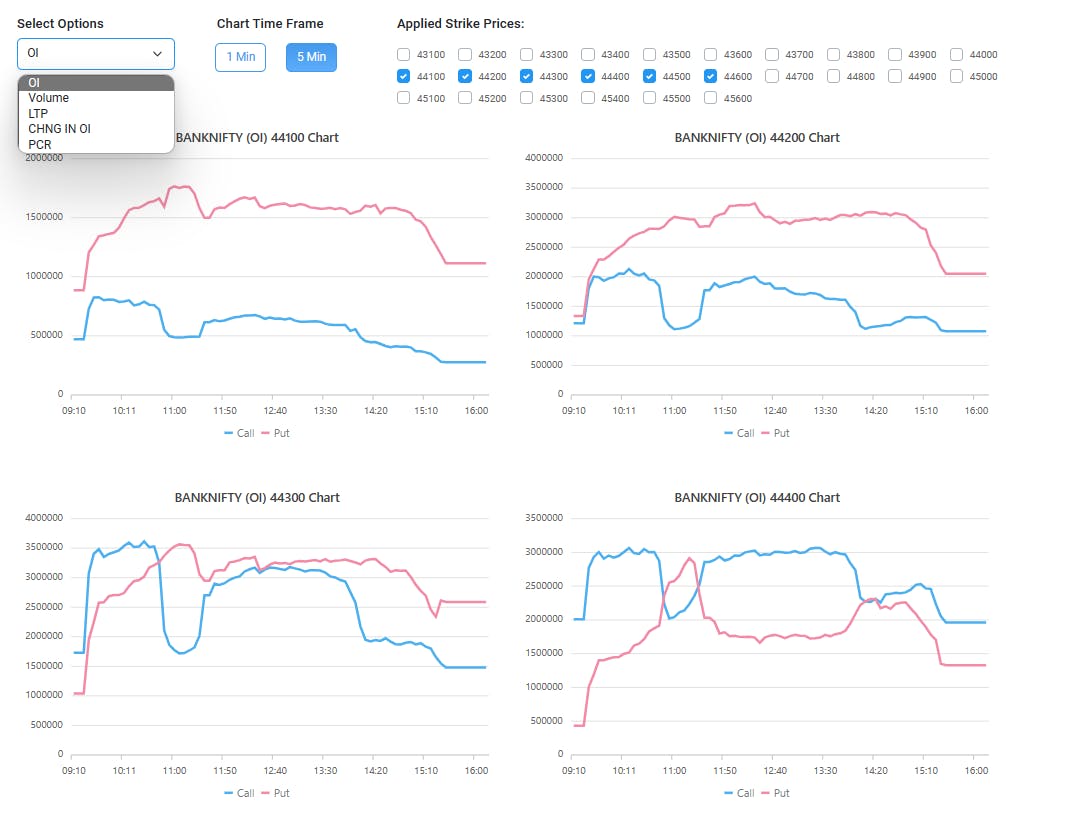
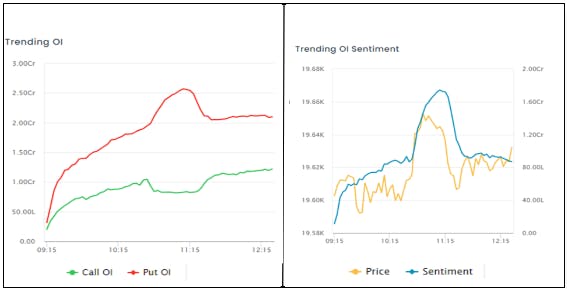
Open interest data can provide insights into market volatility and direction. You can gauge other traders’ market sentiment and expectations by analyzing the changes in open interest across different strike prices and expiry dates. FYERS InstaOptions provides a Trending OI feature that allows you to view the open interest data in a graphical and interactive way. You can easily filter and sort the data by underlying asset, expiry date, strike price, call or put option, and percentage change in open interest. You can also see the trend lines and indicators that show the support and resistance levels and the pivot points. With this feature, you can understand the market sentiment and predict the market direction more accurately.
In the below example, you can find trending OI and sentiment for different strike prices:
Smart Strategy Finder
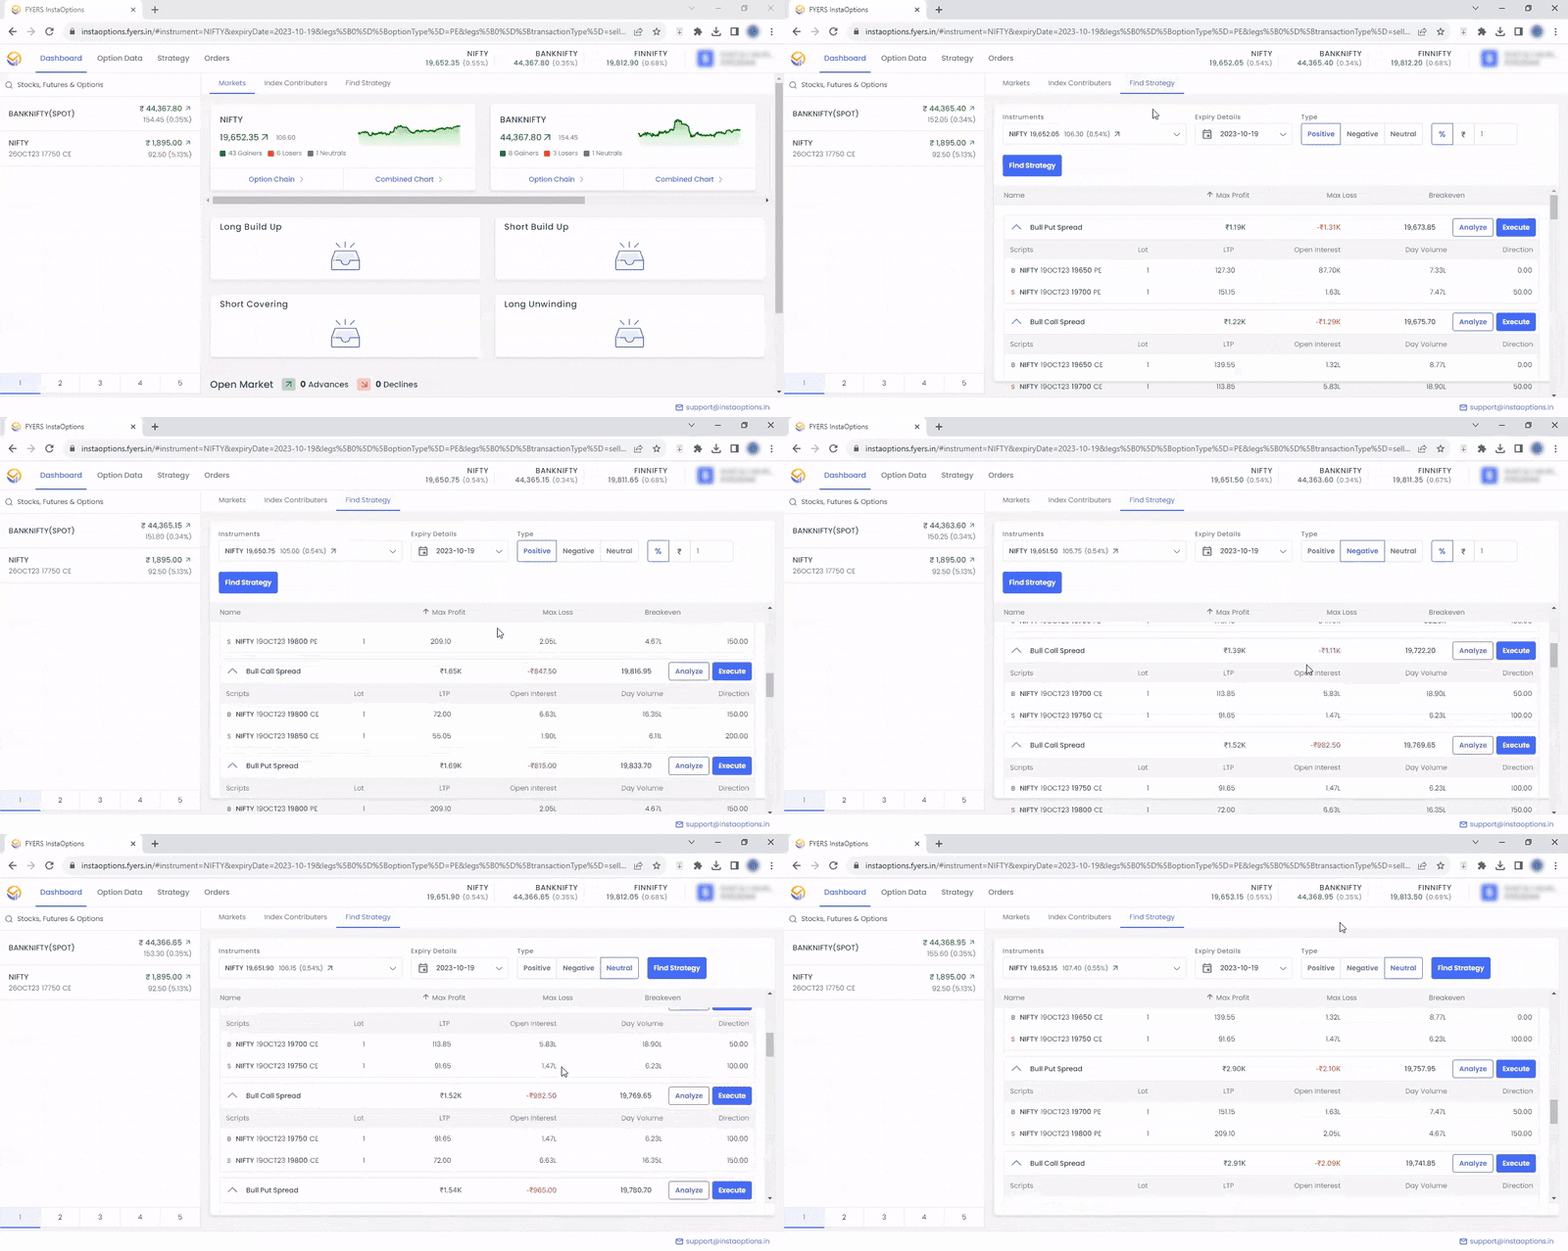
Once you have analyzed the market sentiment and direction, you must find the best options strategy that suits your trading objectives and risk appetite. FYERS InstaOptions provides a Smart Strategy Finder feature that helps you select profitable strategies based on your trend prediction.** You can choose the trend type (Positive /Negative/Neutral), and it will suggest suitable strategies for you to execute.** You can also see each strategy’s payoff chart, risk-reward profile, breakeven points, maximum profit or loss, and other details. With this feature, you can save time and effort finding the optimal options strategy for your trading goals.
Advanced Analytical Tools
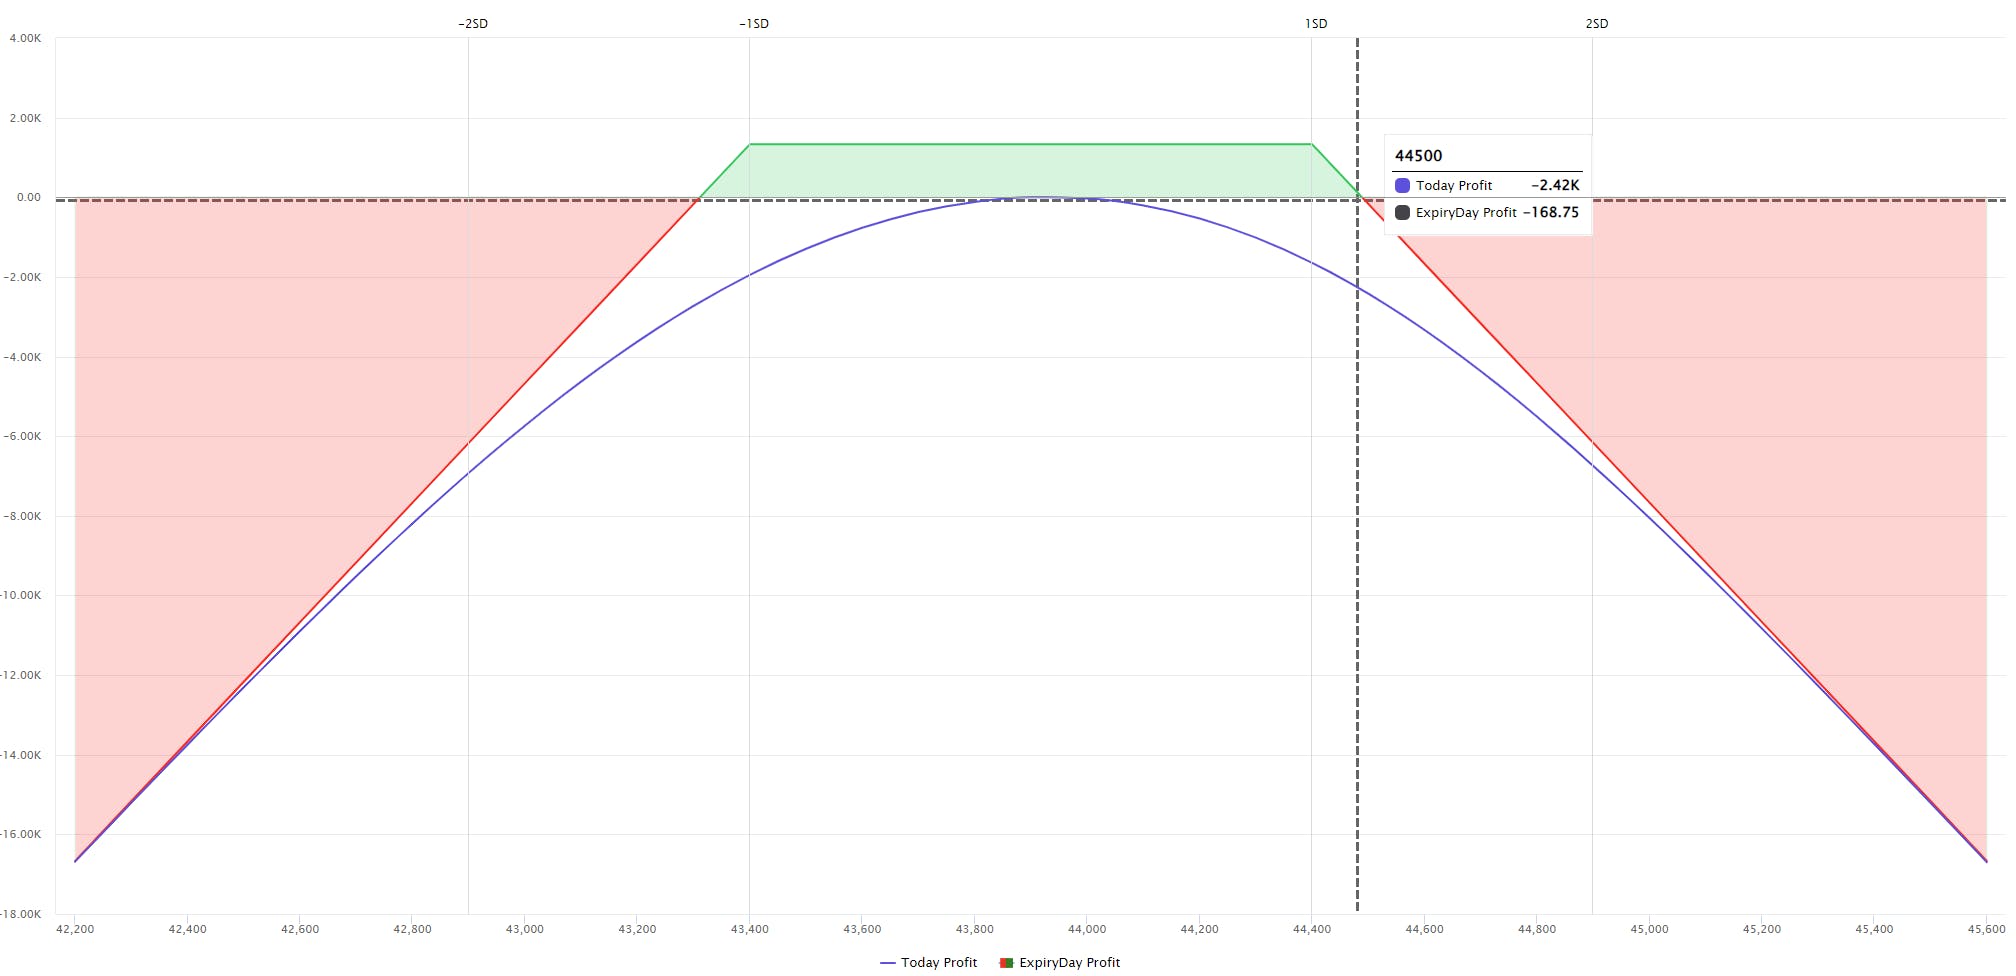
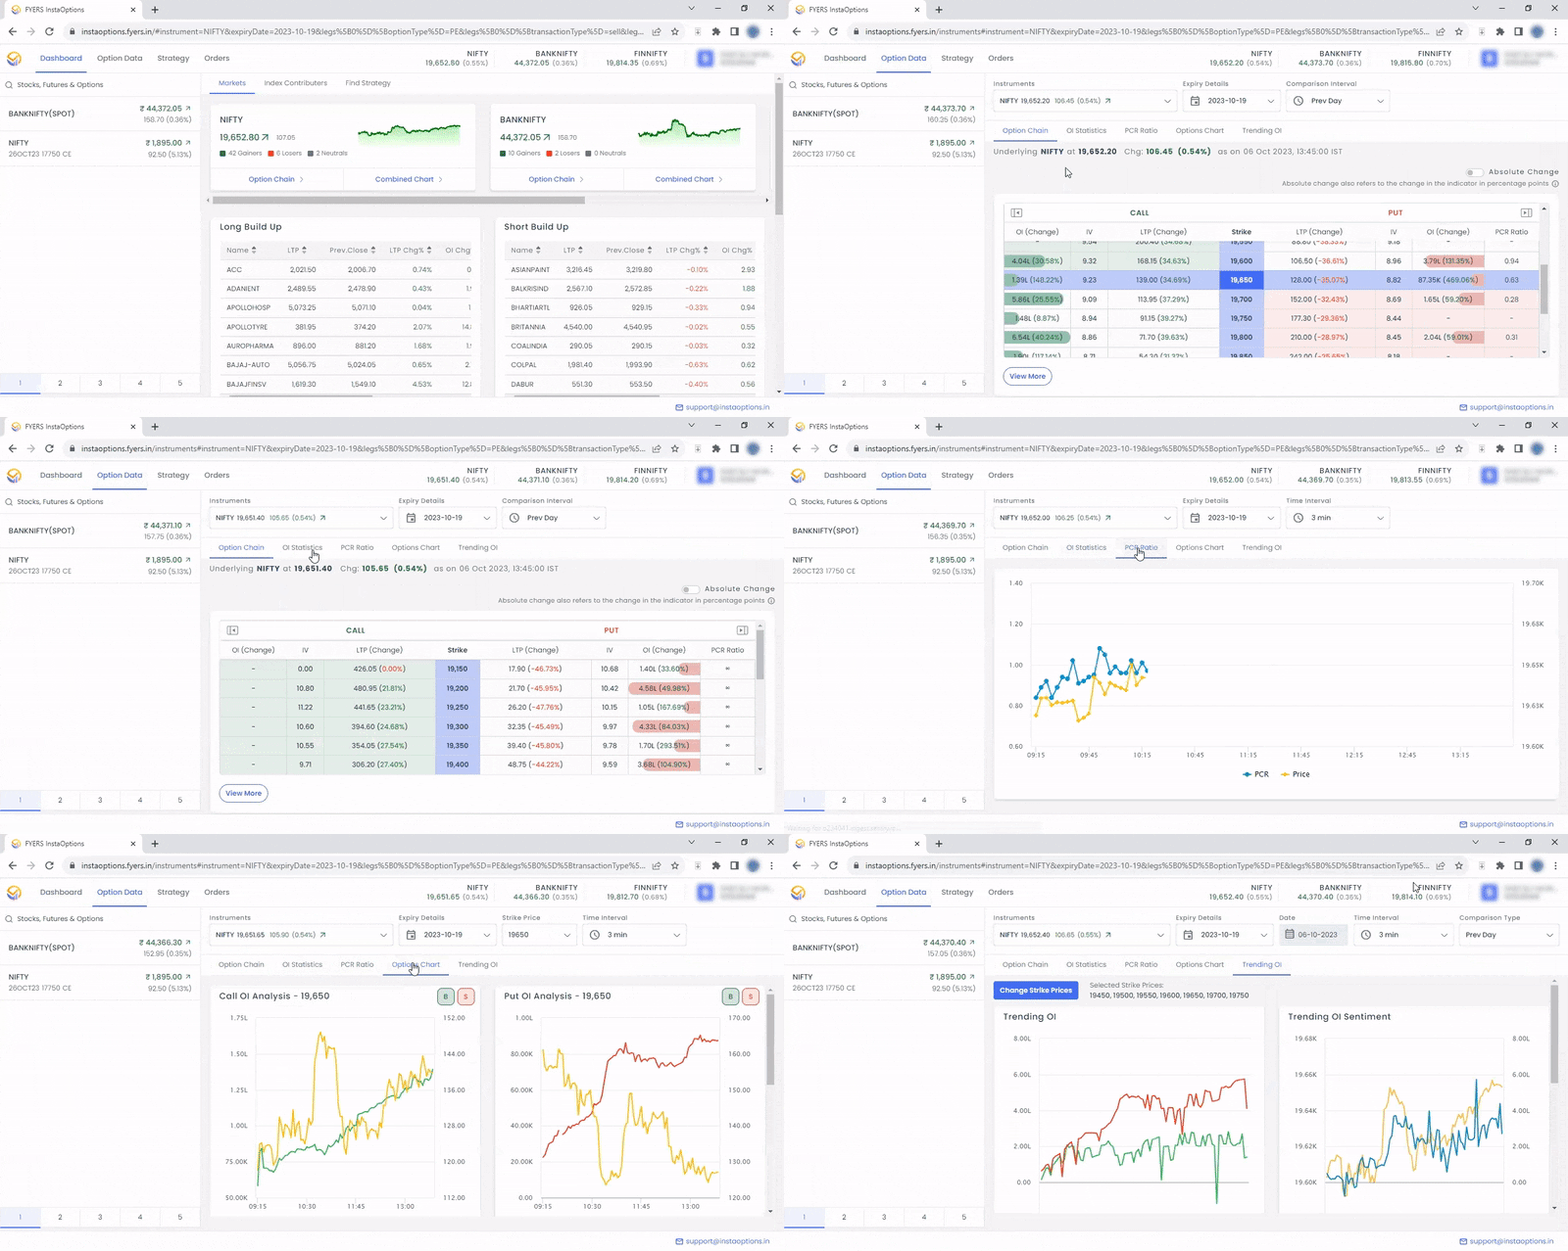
Besides open interest data, other analytical tools can help you to enhance your options trading performance. FYERS InstaOptions provides various advanced analytical tools such as OI Statistics, PCR Ratio, Option Chart, Payoff Chart, and Multi-Strike OI. These tools allow you to access more information and data about the options market, such as the distribution of open interest across different strike prices and expiry dates, the ratio of put to call open interest, the historical and implied volatility of options prices, the payoff diagram of any options position or strategy, and the comparison of open interest across multiple strike prices. With these tools, you can gain more insights and knowledge about options, market dynamics, and behavior.
In the below GIF, you can find options chain data with implied volatility at different strike prices, OI change, PCR ratio:
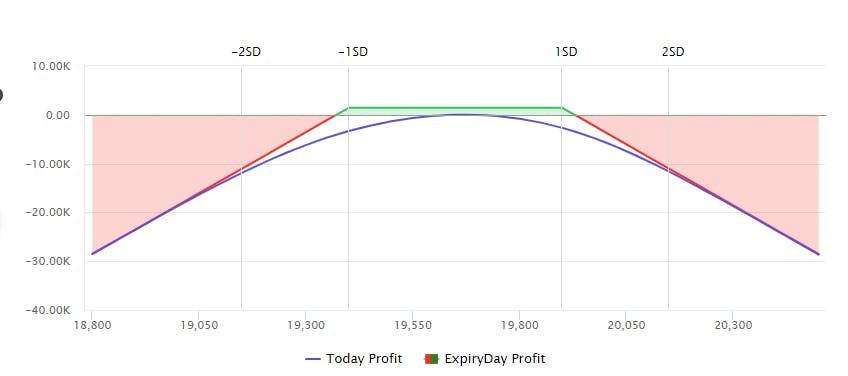
In the below example, you can see how the Payoff chart for a short strangle strategy looks like :
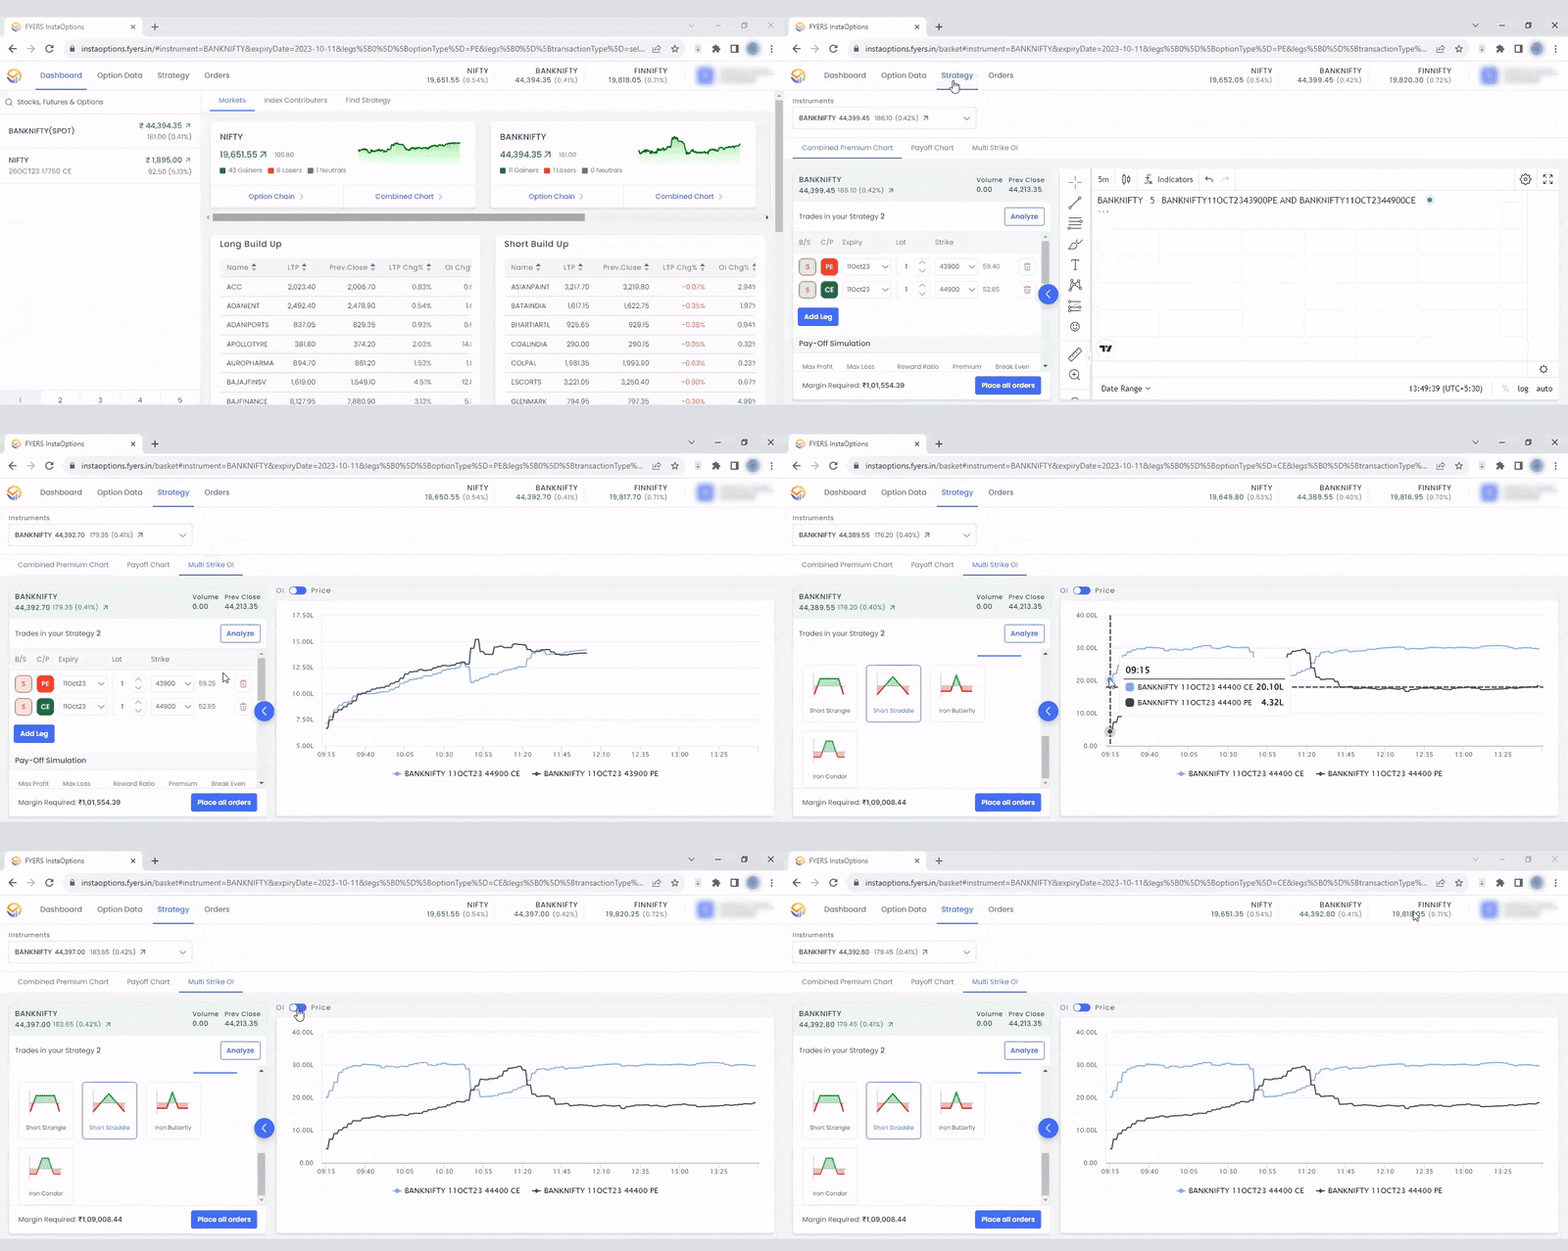
Also, in the GIF shown below you can find Multi strike OI displaying the open interest (OI) and the price of the options contract for the chosen strategy on a line chart.
Efficient Order Execution
After finding and analyzing your options strategy, you can execute your orders quickly and efficiently. FYERS InstaOptions facilitates you to place orders instantly from any application page. We understand how volatile the option premiums are during trading hours.** To avoid slippage for traders, the platform provides a quick order execution facility from most application pages.** You can also use the basket order facility to manage a group of options positions as a single order. Instead of executing individual orders for each option contract within a strategy or portfolio, a basket order allows for the simultaneous entry or exit of multiple options positions.
Ready-made Strategies
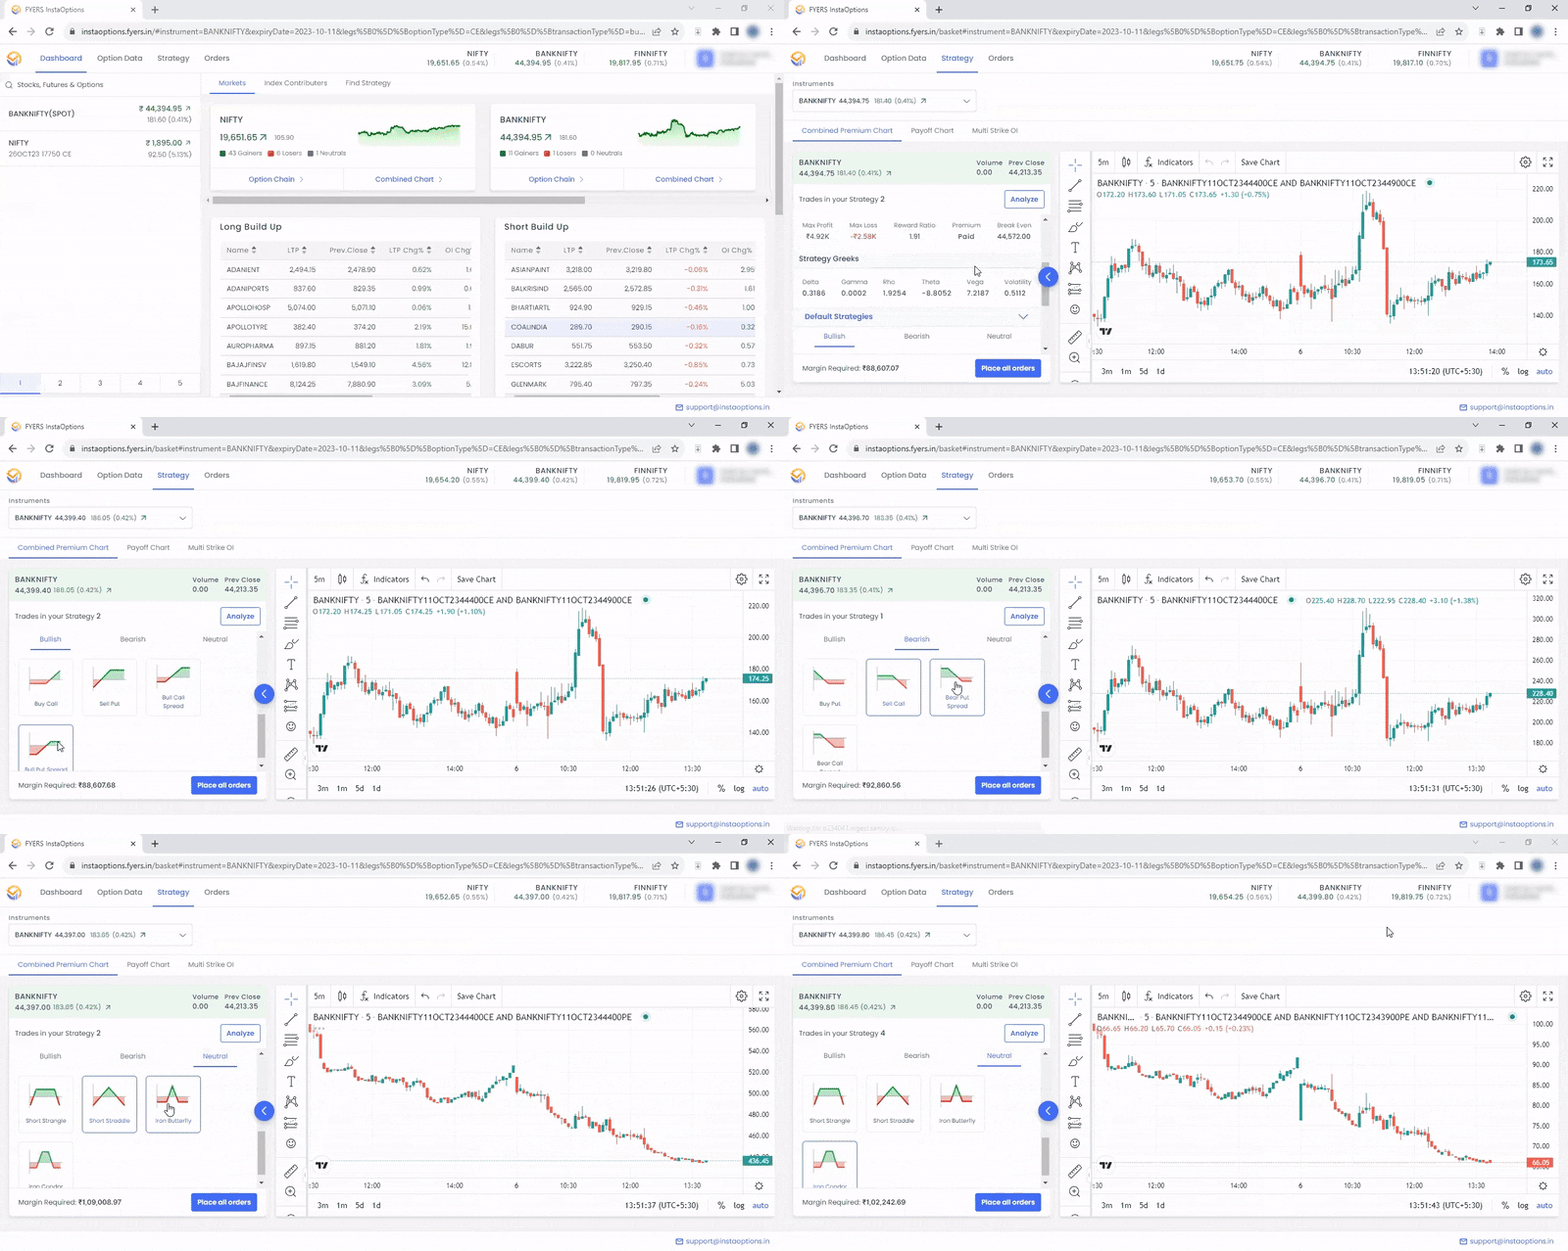
If you are new to options trading or want to explore new strategies, **FYERS InstaOptions provides a list of ready-made strategies you can select based on your trading preferences and execute accordingly. **You can choose from various strategies, such as bullish, bearish, neutral, volatile, hedging, income-generating, etc. You can also see the details and rationale behind each strategy before executing it.
Checkout the GIF below to see the ready-made bullish, bearish and neutral strategies:
Intuitive User Interface
FYERS InstaOptions has a super user-friendly interface for novice and experienced traders, ensuring easy navigation and efficient operation. You can access all the features and tools from the dashboard, which is customizable and user-friendly. Also, the real-time open interest data for various option contracts allows traders to react immediately to market movements.
Conclusion:
Whether you are a beginner or an expert, the FYERS InstaOptions platform has something for everyone. It is the ultimate platform for options traders who want to make their trading journey easier, faster, and more profitable. With its comprehensive and user-friendly features, you can analyze, strategize, and execute your trades more confidently and conveniently.
Try it today by opening a demat account with FYERS and see the difference for yourself