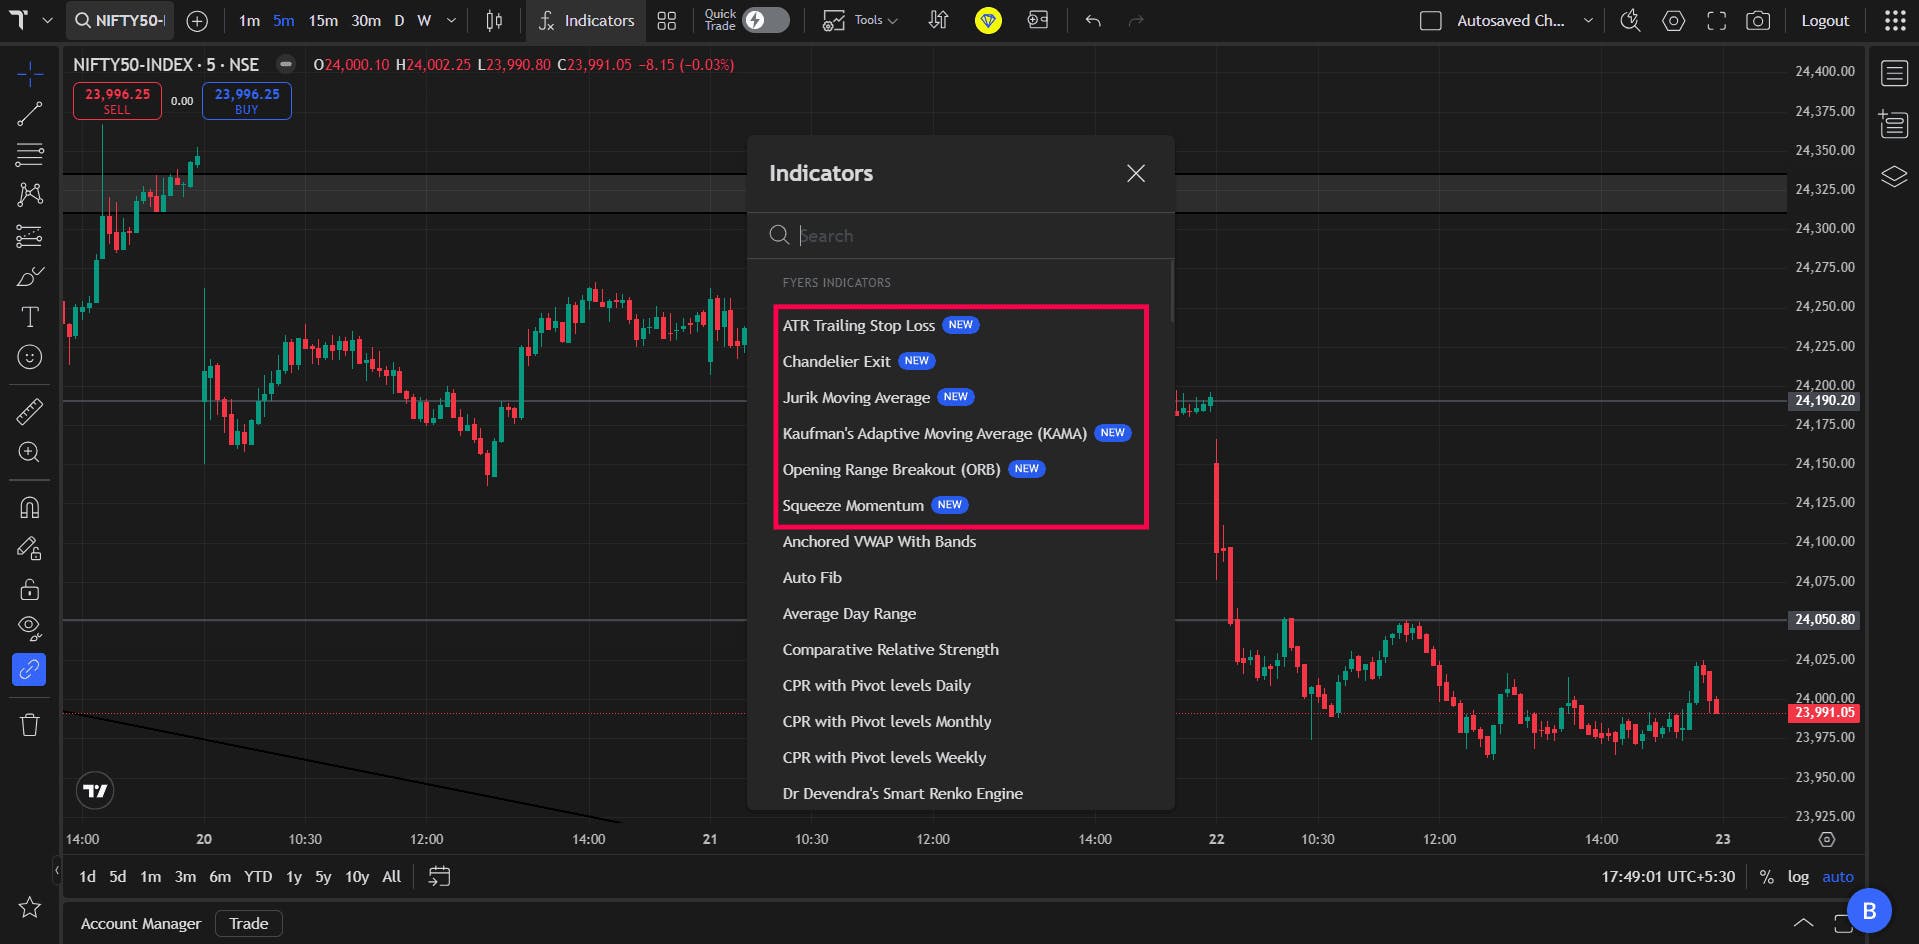
A lot of the improvements we make to the charting experience on FYERS come from the feedback traders share with us.One request that came up consistently was for more indicators to study different aspects of price action, from momentum and breakouts to trend behaviour and exits.
Based on that feedback, we have added six new indicators. Each serves a different purpose, so rather than using all of them together, you can choose the ones that are relevant to the way you analyse and trade.
The new indicators are:
- Squeeze Momentum
- Opening Range Breakout
- ATR Trailing Stop Loss
- Kaufman’s Adaptive Moving Average
- Jurik Moving Average
- Chandelier Exit
You do not need to use all six together. Pick the one that matches the problem you are trying to solve and test it on the charts you already follow.
- Squeeze Momentum and Opening Range Breakout
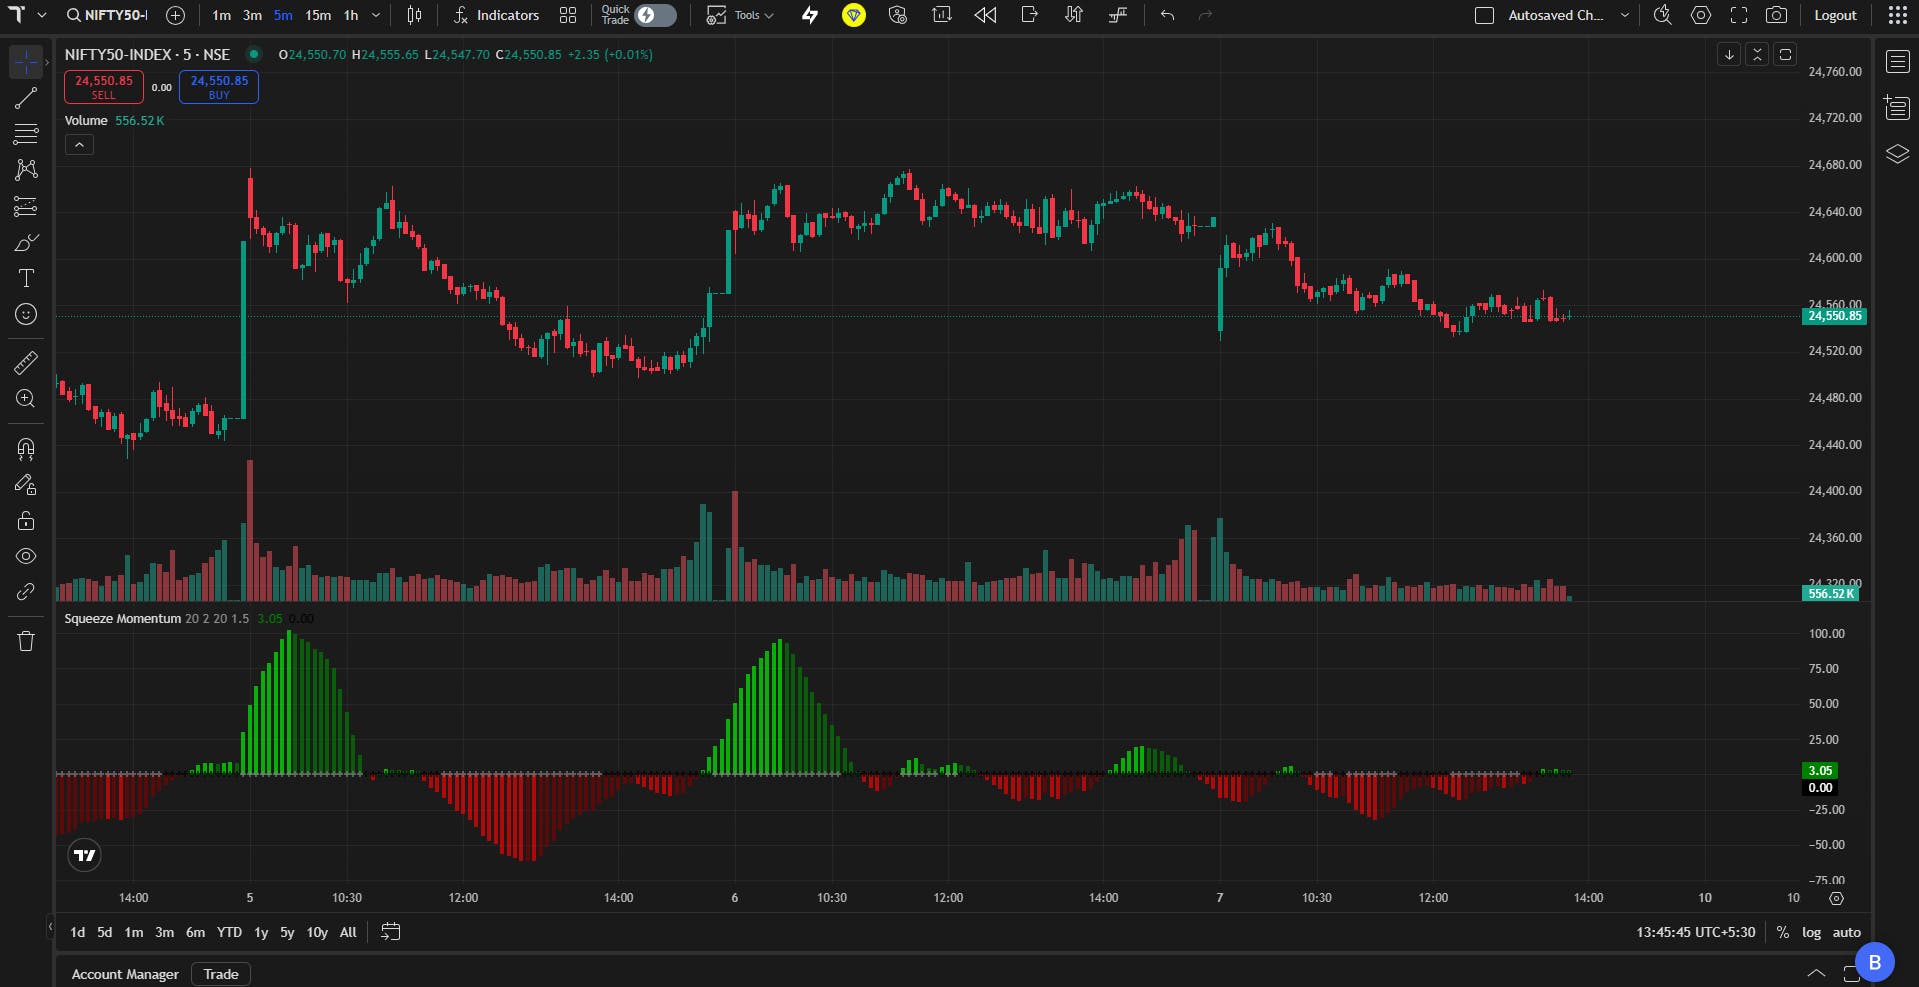
Markets often become quiet before a larger move. A stock may trade inside a narrow range for several candles. Price may appear inactive, but volatility can begin expanding soon after.
A. Squeeze Momentum helps you identify these low-volatility phases and observe when momentum starts to build. It does not tell you whether a breakout will succeed or which direction the market will move. It helps you notice when market conditions are changing, so you can study the setup more closely.
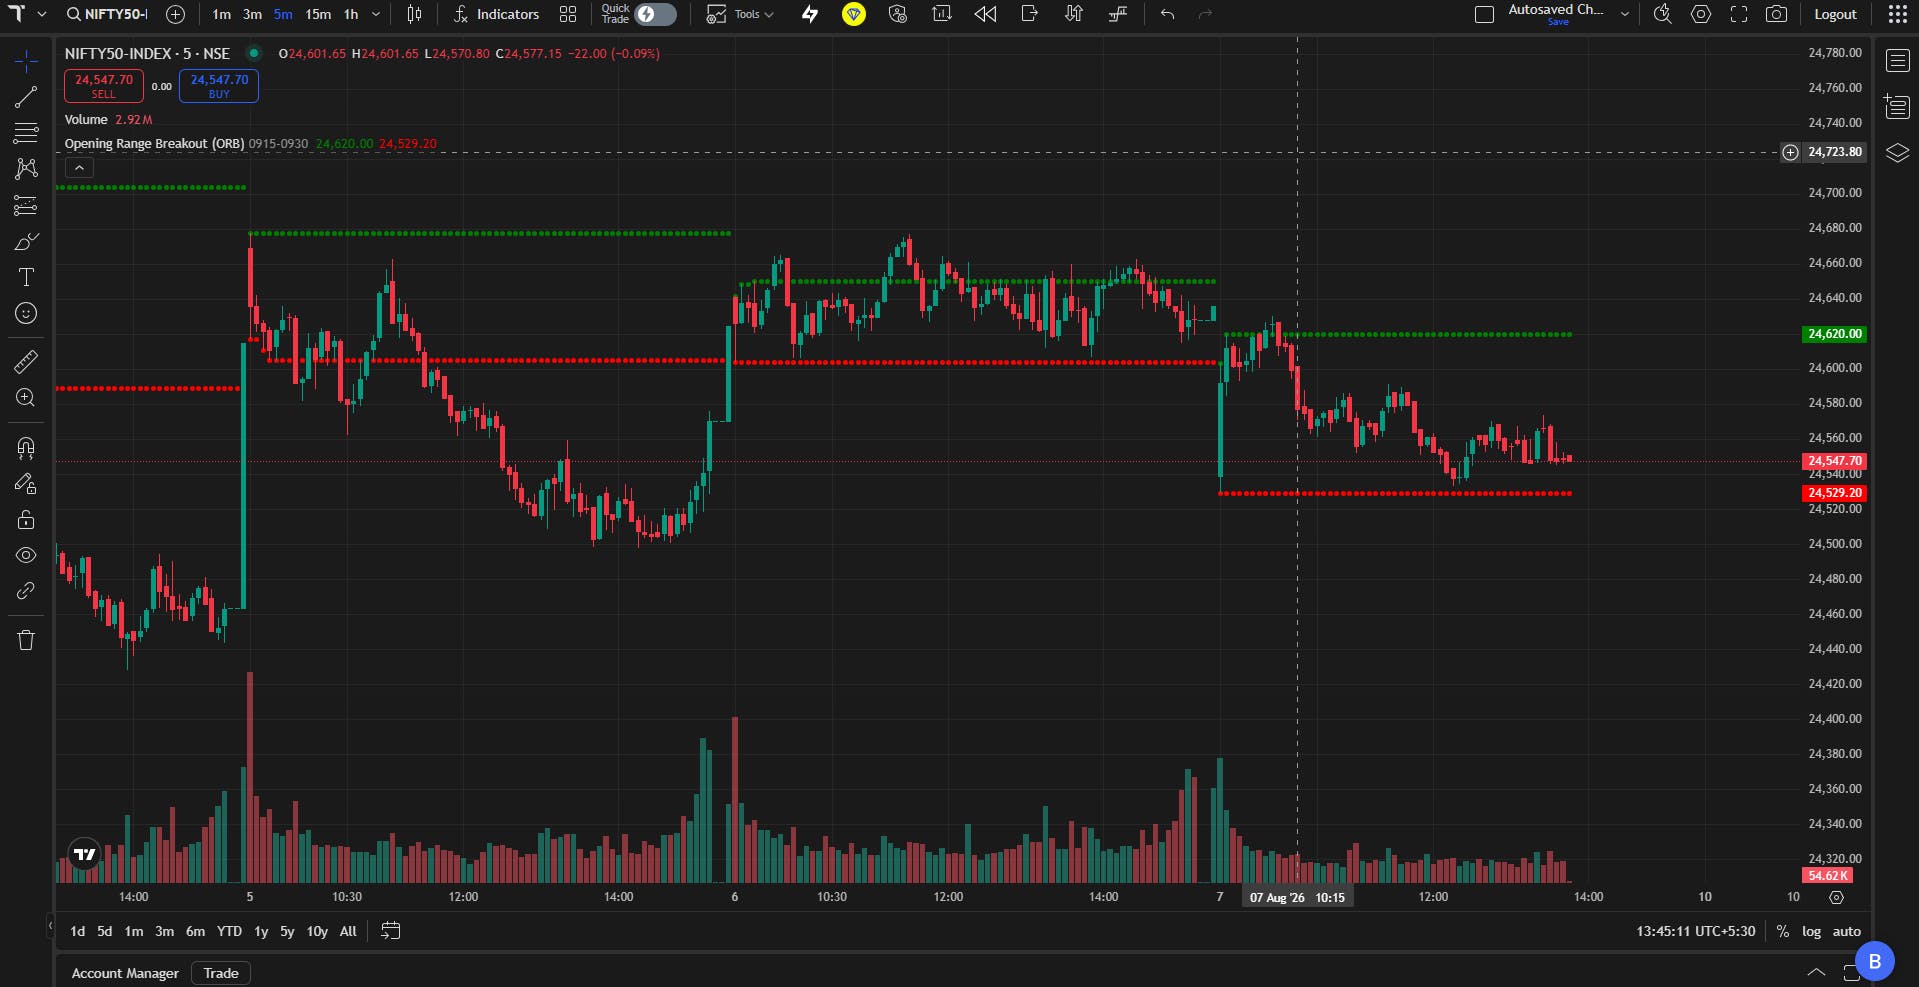
B. Opening Range Breakout (ORB), supports a common intraday trading routine. Many traders mark the highest and lowest prices formed during the opening period of the session, based on the timeframe they follow. The ORB indicator marks these levels automatically and keeps them visible through the day.
This saves you from drawing the same levels manually every morning.
- Kaufman’s Adaptive Moving Average and Jurik Moving Average
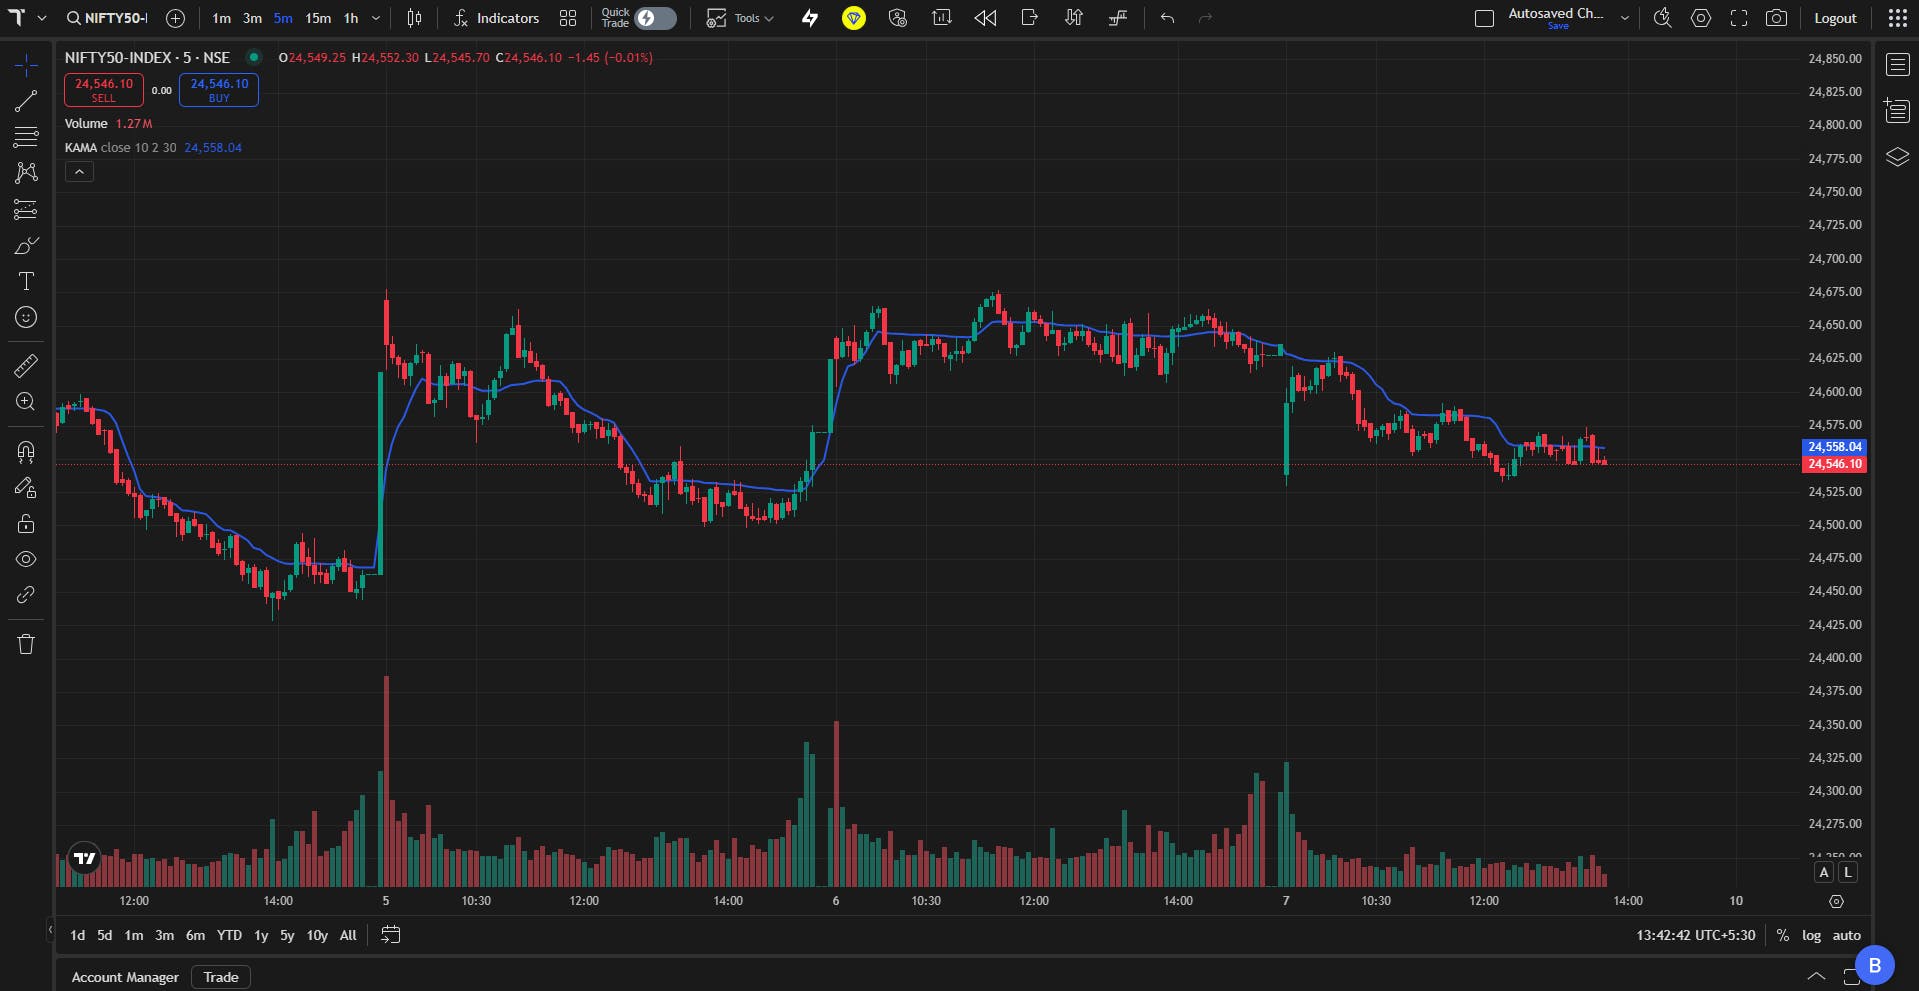
Moving averages are useful, but there is always a trade-off. A faster moving average reacts quickly to price changes, but it may also respond to small and insignificant movements. A slower moving average appears smoother, but it may take longer to reflect a change in trend.
A. Kaufman’s Adaptive Moving Average, (KAMA), adjusts its behaviour based on market conditions. It follows price more closely when the market is moving in a clear direction and slows down when the market becomes sideways, the average responds more slowly and ignores smaller price movements.
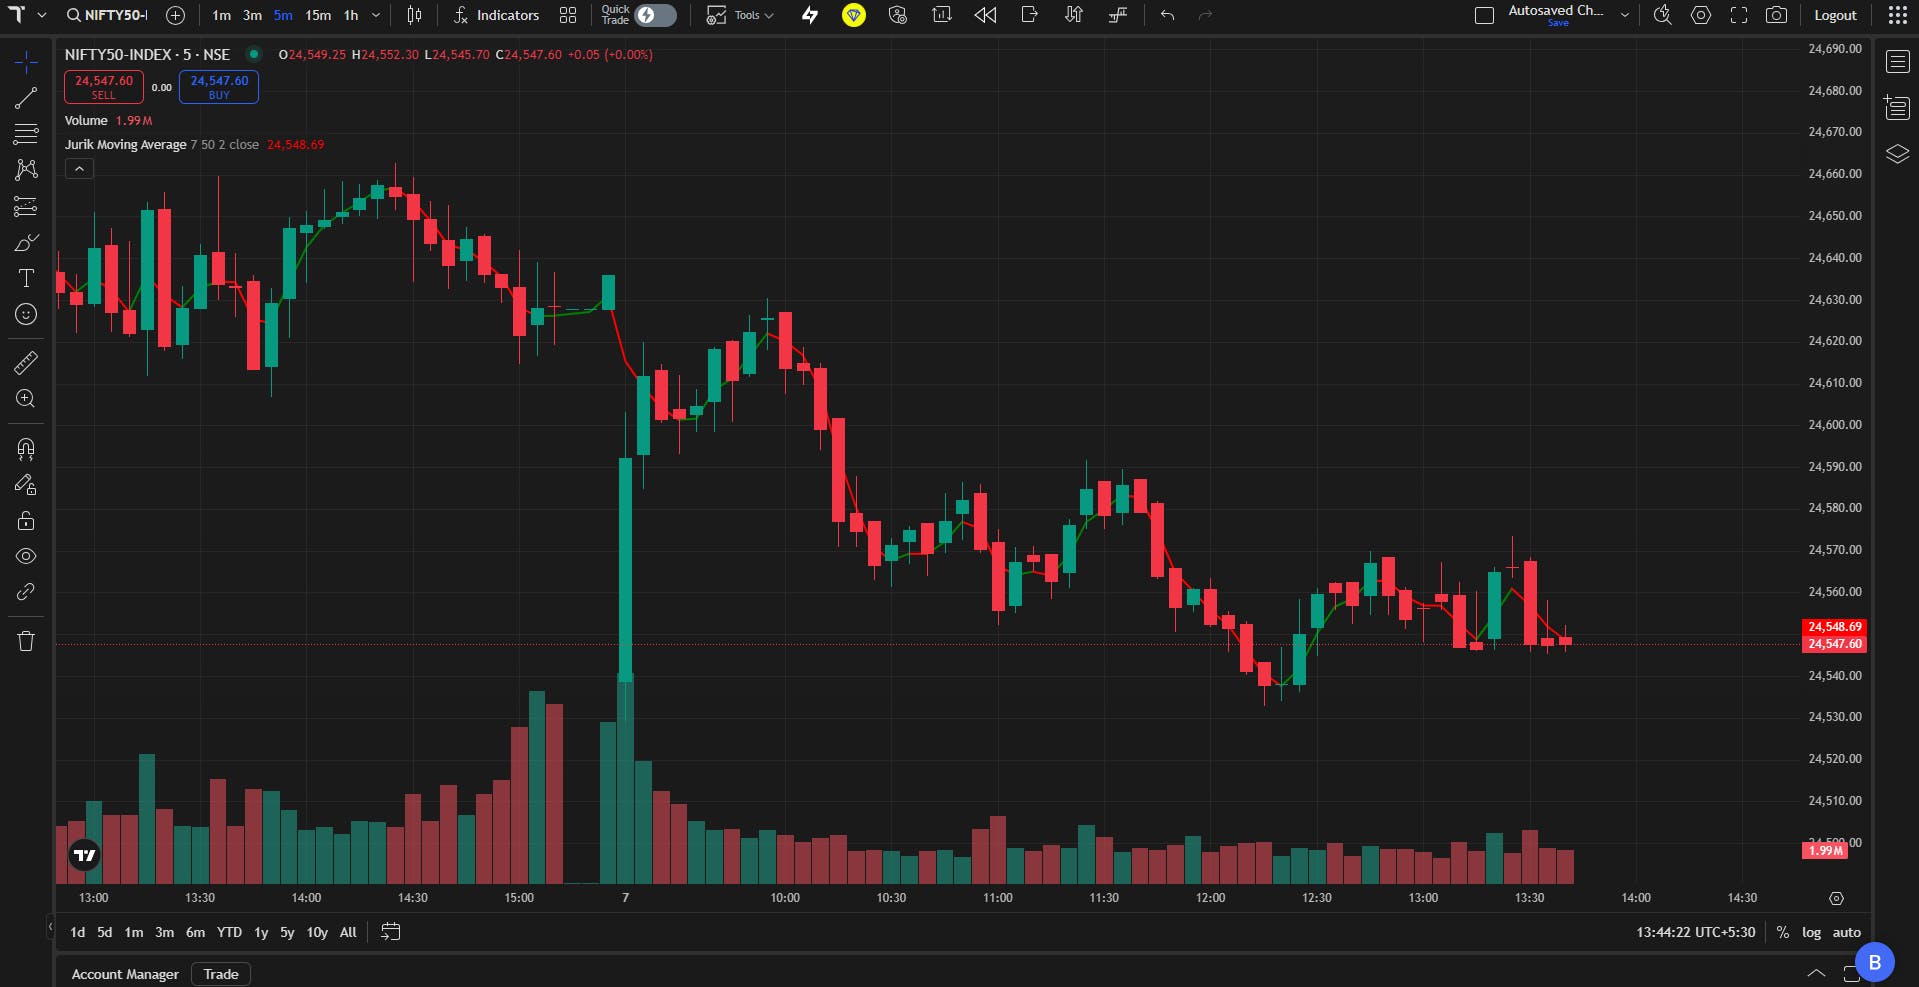
B. Jurik Moving Average, (JMA), gives you another way to view the trend. It is designed to remain smooth while responding relatively quickly when price changes direction. You do not need to replace the moving averages you already use. Add KAMA or JMA to one of your regular charts and compare how they behave on the timeframe you trade.
- ATR Trailing Stop Loss and Chandelier Exit
Entering a trade is only one part of the decision. Managing the exit is often more difficult. A stop-loss placed too close to the entry price may get triggered during a normal pullback. A stop-loss placed too far away may expose you to a larger loss or cause you to give back more of an open profit.
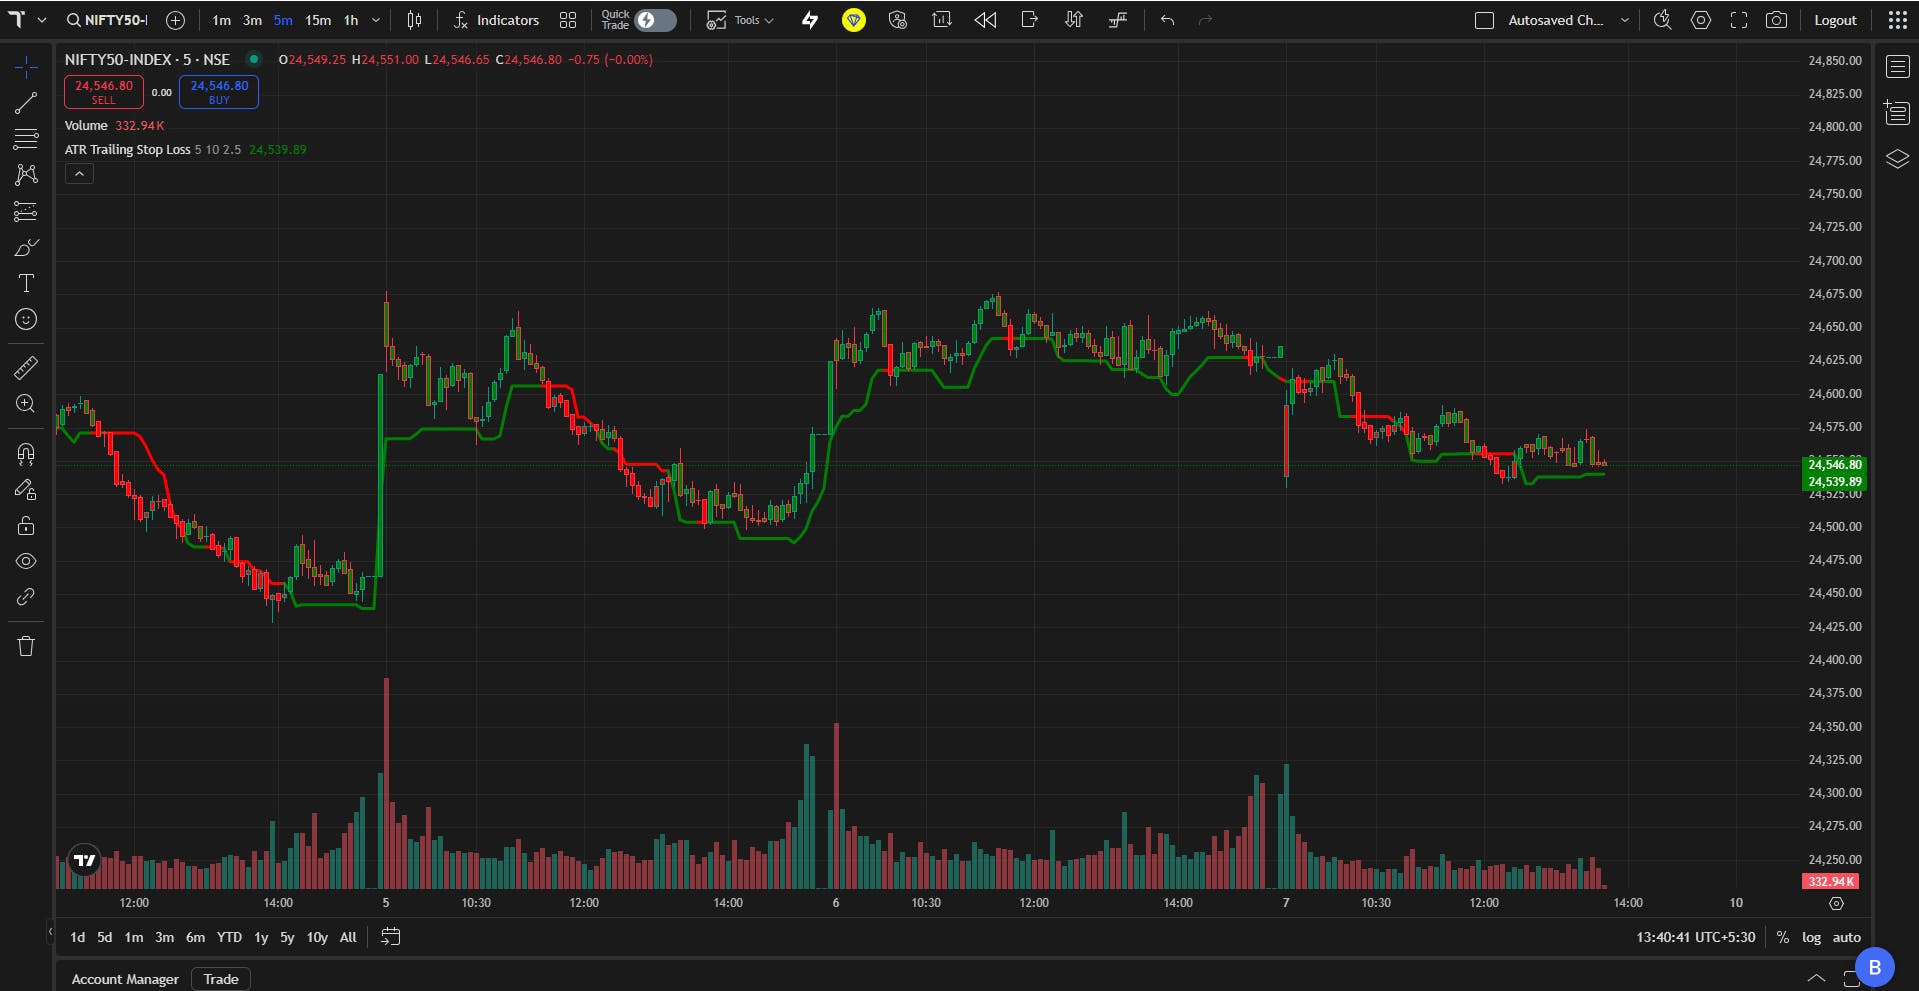
A. ATR Trailing Stop Loss gives you a trailing reference based on recent market volatility. When volatility is high, the reference level gives price more room to move. When volatility reduces, the trailing level can move closer to price.
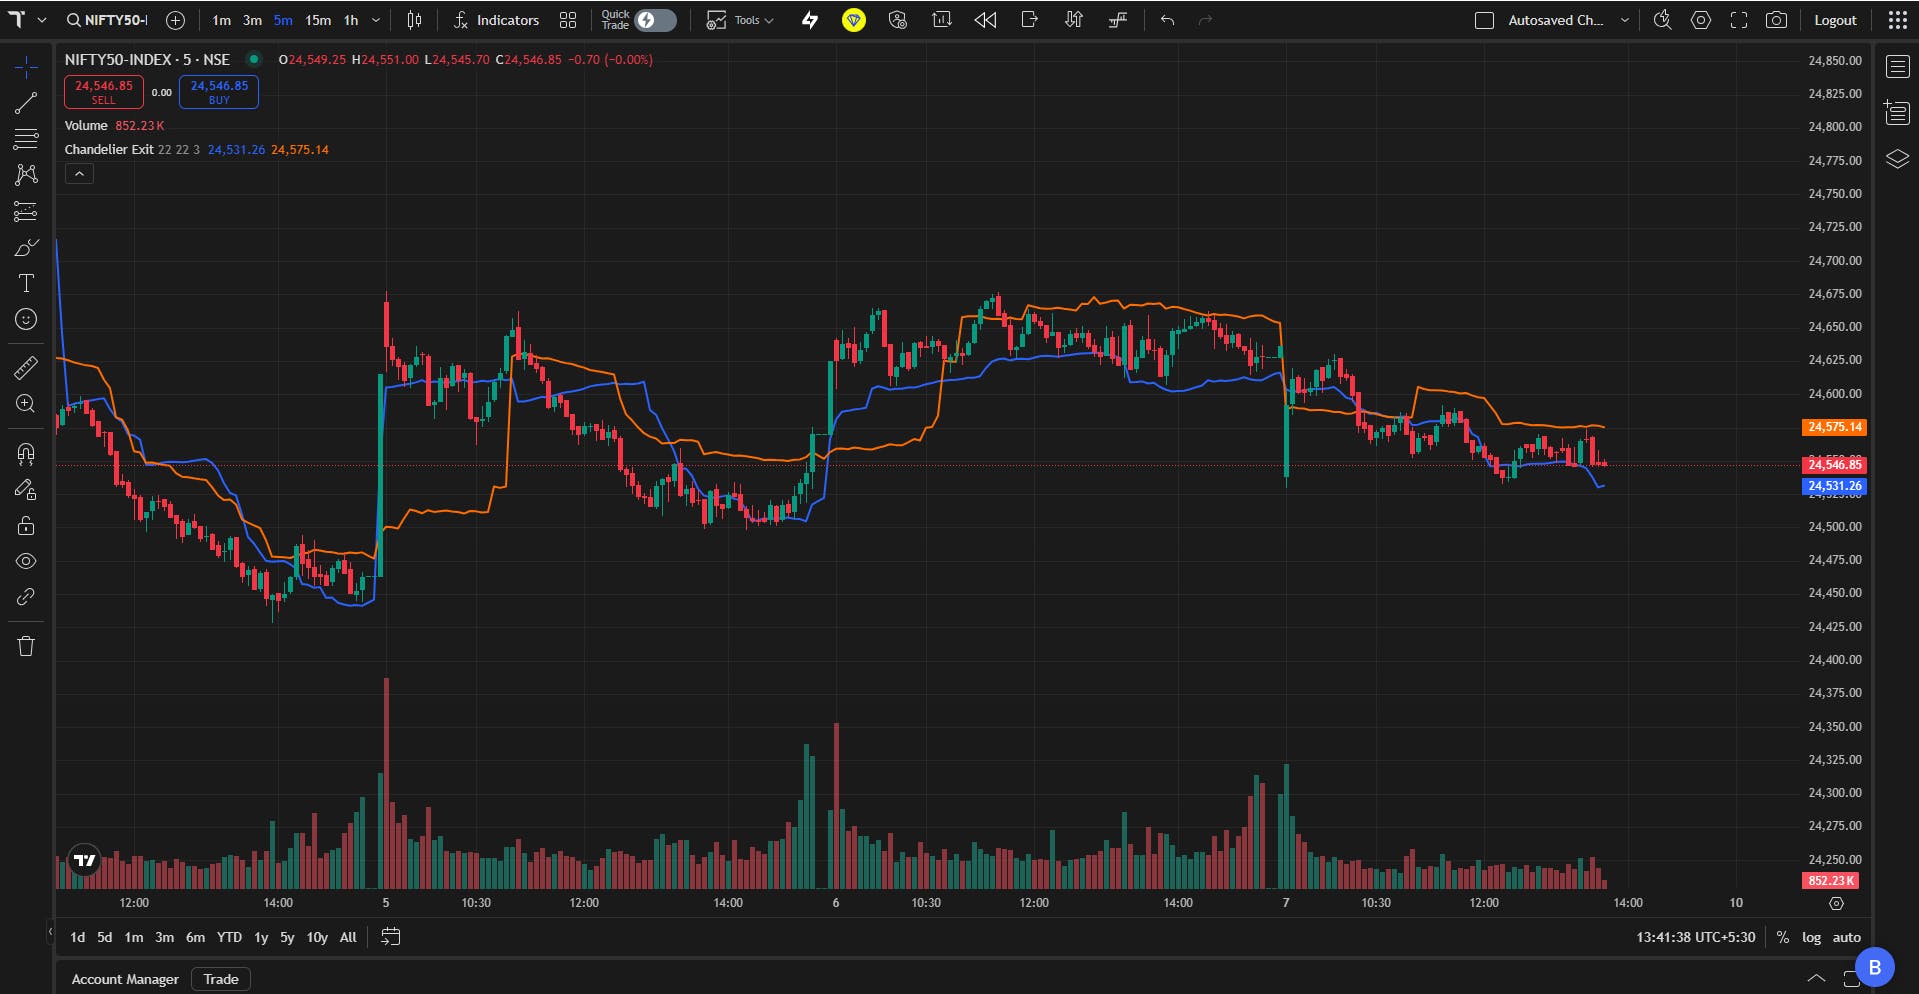
B. Chandelier Exit also gives you a volatility-based reference that follows price as the trend develops. These indicators do not make the exit decision for you. They give you a consistent framework for reviewing an open position and adjusting your approach as market conditions change.
Available across FYERS platforms
The new indicators are available on FYERS Advanced Charts across FYERS Web, FYERS Trader, and FYERS App.
Search for the indicator by name from the Indicators menu and add it to your chart. You can then adjust the settings based on the instrument, timeframe, and trading setup you follow.
