23 Jul, 2025
 4 mins read
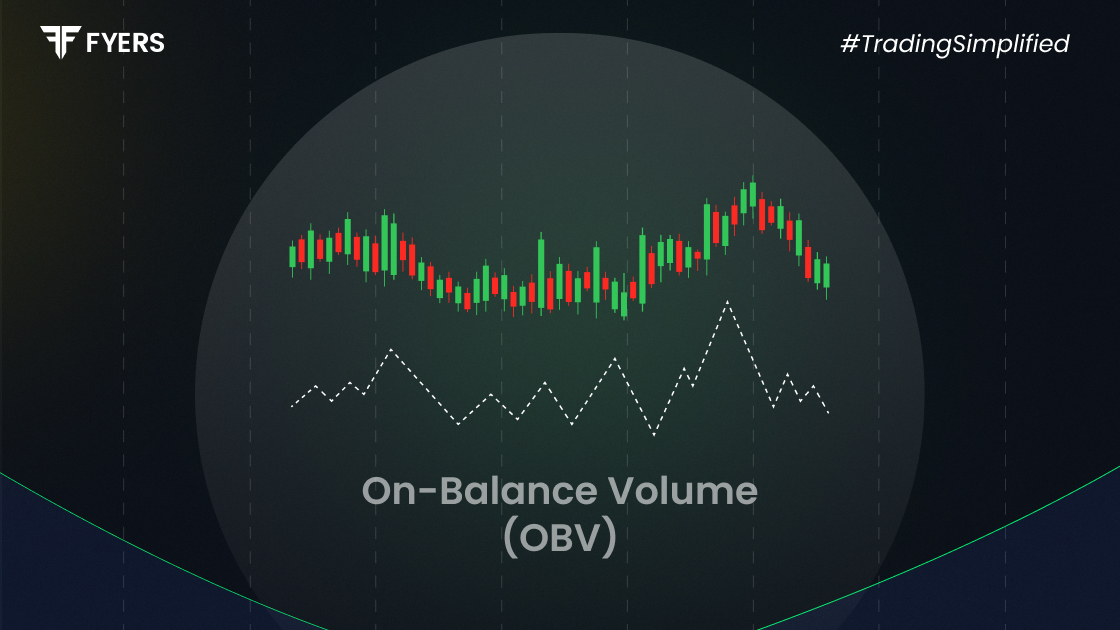
On Balance Volume (OBV) is a momentum-based indicator developed by Joseph Granville in the 1960s. It measures the cumulative buying and selling pressure by adding volume on up days and subtracting it on down days. OBV reflects how volume moves relative to price and helps traders gauge the strength of market trends.
In theory, if price movements are supported by strong volume, they’re more likely to sustain. Conversely, when prices rise on weak volume, the trend may be fragile or short-lived.
The OBV indicator assumes that volume precedes price. This means significant volume activity could signal a potential price move before it actually occurs. Traders use OBV to confirm trends or identify possible reversals.
When OBV rises along with price, it suggests buying pressure and confirms the upward trend. When OBV falls while the price is rising, it may indicate a divergence—an early warning sign of a potential reversal.
This makes the OBV indicator especially useful in trend-following strategies, where understanding momentum is crucial.
The OBV calculation is straightforward:
1. If today’s closing price > yesterday’s closing price:
OBV = Previous OBV + Today’s Volume
2. If today’s closing price < yesterday’s closing price:
OBV = Previous OBV - Today’s Volume
3. If today’s closing price = yesterday’s closing price:
OBV = Previous OBV
This running total of volume helps track the cumulative pressure behind market moves. However, it’s important to note that the OBV line is a relative measure—it doesn't carry standalone numerical meaning. Its strength lies in direction and pattern, not absolute values.
While OBV works well in normal trading conditions, it can produce misleading signals during flash crashes. A flash crash is a rapid and deep market decline followed by a swift recovery, often triggered by panic selling or algorithmic trading anomalies.
Here’s where OBV can go wrong:
Sharp volume spikes: Flash crashes are accompanied by abnormal volumes. These sudden surges can distort the OBV line, making it appear as if a strong trend is forming or breaking down.
False breakouts: During a crash, OBV may fall steeply even if the market recovers minutes later. This abrupt change often leads traders to exit positions prematurely.
Lag in recovery: OBV reacts to volume but not context. It may continue signalling weakness even when the price stabilises, leading to delayed entries or missed opportunities.
In such volatile conditions, OBV loses reliability as it treats all volume equally—whether driven by fear, algorithms, or fundamental shifts.
Understanding when OBV misleads is essential for reducing trading errors. Below are the most common false signals:
Large volume on a sharp drop doesn’t always signal long-term weakness. It may be a one-off panic event. Always compare OBV signals with market sentiment or news triggers.
Bearish divergence (falling OBV with rising price) can suggest an upcoming drop—but during flash crashes or news-based spikes, this signal might be premature.
OBV often confirms existing trends, but during erratic sessions, it may misalign with price movements, leading to wrong conclusions.
Use multiple indicators: Combine OBV with RSI, MACD, or Bollinger Bands to validate signals before acting.
Incorporate volume divergence analysis: Look for inconsistencies between price and volume growth. True momentum should be visible across more than just OBV.
Check higher timeframes: Daily OBV fluctuations can be noisy. A longer-term view often filters out short-term volatility.
Avoid trading during erratic news: If a flash crash is news-driven, wait for volume to normalise before re-entering trades.
Despite its flaws in extreme volatility, the On Balance Volume indicator remains useful for swing and intraday traders—especially when paired with structure and discipline.
In swing trading, OBV helps confirm the direction of medium-term trends. If a stock breaks resistance with a rising OBV, the move is likely supported by genuine buying pressure.
In intraday trading, OBV can signal accumulation or distribution patterns. For example, rising OBV during a consolidation phase may hint at an upcoming breakout.
Entry: Look for a breakout supported by rising OBV and higher-than-average volume.
Stop-loss: Set just below the breakout point or key support.
Exit: Use OBV divergence as an early warning to reduce exposure or tighten stops.
The On Balance Volume indicator is a trusted tool in technical analysis, especially for identifying trend strength and volume-based confirmations. However, its effectiveness weakens during flash crashes due to erratic volume spikes that distort signals.
To improve your on balance volume trading strategy, avoid relying solely on OBV—always combine it with other technical tools and assess broader market conditions. Understanding OBV’s limitations allows traders to interpret its readings with more nuance, particularly during high-volatility events.
Ultimately, OBV remains valuable when used with discipline and in context—not as a standalone trigger.
The OBV indicator measures buying and selling pressure through cumulative volume, helping traders confirm trends and spot potential reversals.
OBV adds volume on up days and subtracts it on down days, creating a running total that reflects volume momentum behind price changes.
Flash crashes cause sudden volume spikes that distort OBV readings, often leading to false signals or divergence traps.
Combine OBV with other indicators like RSI or MACD, use higher timeframes, and avoid trading immediately after sudden news-based volatility.
Calculate your Net P&L after deducting all the charges like Tax, Brokerage, etc.
Find your required margin.
Calculate the average price you paid for a stock and determine your total cost.
Estimate your investment growth. Calculate potential returns on one-time investments.
Forecast your investment returns. Understand potential growth with regular contributions.

Commodity trading on the Multi Commodity Exchange (MCX) is an…
17 Jun, 2025
2 mins read

You have successfully submitted your partnership request form. You will be hearing us soon!