
 5 Apr, 2025
 4 mins read

In the world of investing, understanding risk is just as important as identifying opportunities for returns. One of the key tools investors use to assess risk is Beta, a metric that measures how much a stock’s price moves in relation to the overall market. Whether you're a beginner building your first portfolio or a seasoned trader refining your strategy, knowing a stock's beta can help you make more informed decisions. In this article, we’ll break down what beta means, how it's calculated, and why it plays a crucial role in evaluating market volatility and portfolio risk.
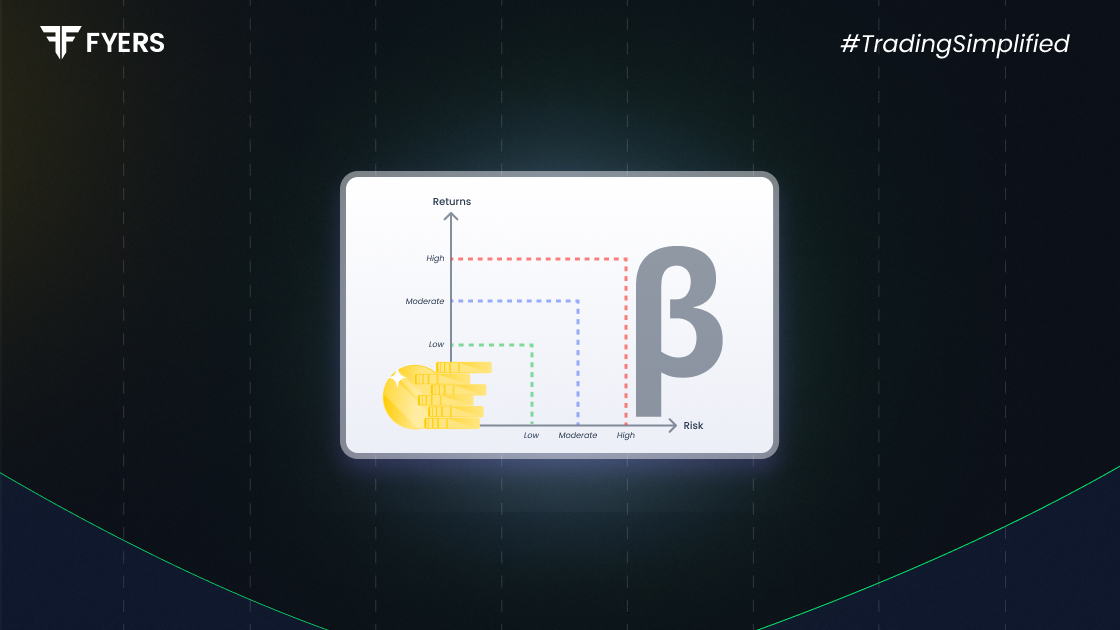
Beta measures how sensitive a stock is to market movements. It shows how much a stock's price might change when the overall market fluctuates. Analysts calculate beta against a benchmark index like the Nifty 50 or Sensex in India or S&P 500 globally.
Beta = 1:
The stock moves in line with the market. If the market goes up 5%, the stock is expected to go up 5% too (on average).
Beta > 1:
The stock is more volatile than the market. If beta is 1.5, and the market moves up 5%, the stock might go up 7.5%. But it works the same in the opposite direction too, it can fall harder during downturns too.
Beta < 1:
The stock is less volatile than the market. If beta is 0.5, and the market goes up 5%, the stock may rise only 2.5%.
Beta < 0 (Negative Beta):
Rare, but it means the stock moves in the opposite direction of the market. Example: Gold often has a low or negative beta as it may rise when markets fall.
Beta is calculated by comparing how much a stock’s price moves up or down compared to how much the overall market represented by an Index like Nifty50 or Sensex moves during the same time.
Imagine it like this:
If the market goes up or down, you check how the stock moved in response.
You do this over a period of time—say, the last 1 or 2 years.
Then, you use regression analysis to find out the average relationship between the stock’s returns and the market’s returns.
Let’s say:
The Nifty 50 (market) goes up 10%
Stock A goes up 12%
This happens consistently over time.
Then Stock A will have a beta greater than 1, because it moves more than the market.
If Stock B goes up only 6% when the market goes up 10%, it has a beta less than 1, because it moves less than the market.
The formula to calculate beta is:
| β=Covariance (Stock Returns, Market Returns)/Variance (Market Returns) |
Where:
Covariance tells us whether the stock and the market move together.
Variance shows how much the market's returns move around from the average.
Identify historical price data for both the stock and its benchmark index (e.g., Nifty 50) for period of 1-2 years..
Calculate daily or monthly returns for both.
Compute the covariance between the stock's and market's returns.
Divide this by the variance of the market’s returns.
Beta offers several benefits for your investment strategy. It quantifies market risk in a simple number. This makes comparing different stocks easier.
You can use beta for portfolio diversification. By mixing high and low-beta stocks, you can adjust your portfolio's overall risk level.
Beta helps in setting return expectations. Higher beta stocks should deliver higher returns to compensate for their additional risk.
It's useful for CAPM (Capital Asset Pricing Model) calculations. This model helps determine a stock's expected return based on its risk profile.
Despite its usefulness, beta has some drawbacks. It assumes markets are efficient, which isn't always true. Market anomalies can skew beta calculations.
Beta uses historical data, which may not predict future volatility accurately. Market conditions change, and past relationships might not hold.
It doesn't account for company-specific risks. Events like management changes or new products aren't captured in beta calculations.
Short-term traders might find beta less useful. It works better for long-term investment horizons rather than day trading strategies.
Beta is a powerful tool that helps investors understand how sensitive a stock is to market movements. By measuring a stock’s volatility compared to the broader market, beta offers valuable insights into the risk profile of an investment. Whether you’re building a low-risk portfolio with stable, low-beta stocks or seeking higher returns with high-beta ones, understanding beta can help you make more informed and strategic decisions. However, it's important to remember that beta reflects past performance, and should be used alongside other financial metrics for a well-rounded investment approach.
A "good" beta depends on your investment goals:
For high growth: Look for high-beta stocks (>1).
For stability: Choose low-beta stocks (<1).
A beta of 1.5 shows that a stock is 50% more volatile than the market. If the market rises 10%, this stock would likely rise about 15%. The same applies to downward movements.
High-beta stocks aren't inherently good or bad. Their suitability depends on your risk tolerance and market conditions. They perform well in rising markets but fall harder during downturns.
Consider a hypothetical example where Tata Motors has a beta of 1.8. If the Nifty 50 increases by 5%, Tata Motors might gain around 9% (5% × 1.8).
Calculate your Net P&L after deducting all the charges like Tax, Brokerage, etc.
Find your required margin.
Calculate the average price you paid for a stock and determine your total cost.
Estimate your investment growth. Calculate potential returns on one-time investments.
Forecast your investment returns. Understand potential growth with regular contributions.