3 Sep, 2024
 5 mins read
The core of the technical analysis is to use various tools like chart patterns, candlesticks, etc., to make sense of the price and volume movements. The price fluctuations represented by highs and lows often pause for a brief period of consolidation before showing a definite trend. Such price movement forms a chart pattern known as the pennant pattern. Are you a new trader who wants to know more about this pattern? Check out this blog to learn about pennant patterns and how to trade using pennant patterns.
The pennant pattern is a technical chart pattern that forms when the price of an asset experiences a sharp move up or down, then pauses and consolidates before continuing in the original direction.
Visually, it looks like a small, symmetrical triangle with converging trendlines. This pattern typically indicates that the asset is preparing for a strong breakout in the direction of the previous trend. Recognising a pennant can be a valuable signal for traders to anticipate potential price movements and make more informed trading decisions.
Pennant patterns can be identified using a few key characteristics. These characteristics are-
First Flagpole: A strong initial movement up or down sets up the pennant pattern coupled with a large trading volume.
Pennant Pattern: A consolidation period occurs between two converging trend lines, forming the pennant shape accompanied by weakening volume, indicating reduced trading activity.
Second Flagpole: The price breaks out of the pennant in the same direction as the initial movement, creating the second flagpole backed by a large volume, confirming the continuation of the trend.
These characteristics help traders identify a pennant pattern and anticipate potential price movements.
A pennant chart pattern indicates a brief pause in the market after a strong price movement, suggesting that the price will continue in the same direction once the pause is over. It begins with a significant price rise or fall, forming the "flagpole."
Then, the price consolidates within two converging trendlines, creating the pennant shape. During this phase, trading volume decreases, showing reduced activity as traders wait for the next move.
Finally, the price breaks out of the pennant in the same direction as the initial movement, often with increased volume, signalling a continuation of the trend. Recognising this pattern helps them anticipate potential trading opportunities by identifying when the market will likely resume its previous trend after consolidation.
Pennant patterns can provide significant insights into market movements. Here is how pennant patterns can be important in technical analysis.
The pennant chart pattern is crucial in technical analysis as it helps traders identify continuation patterns. When a strong price movement pauses and forms a pennant, the market takes a brief break before continuing in the same direction. This allows traders to anticipate future price movements and plan their trades accordingly.
Timing is everything to get successful trades. The pennant pattern provides clear signals for entry and exit points. By recognising the formation of the pattern, traders can enter trades during the consolidation phase or right before the break, which can help them maximise their potential gains. Similarly, the pattern can signal when to exit a trade to lock in profits.
A pennant pattern can also confirm the strength of a trend. The initial flagpole, formed with high volume, shows strong market interest. The subsequent consolidation phase with decreasing volume suggests that the market is temporarily cooling off. When the price breaks out with increased volume, it reaffirms the strength and direction of the original trend.
Incorporating pennant patterns into trading strategies enhances a portfolio's overall effectiveness. By understanding this pattern, traders can make more informed decisions, reduce risks, and improve their chances of success. A pennant pattern is a powerful tool in a trader's technical analysis toolkit, offering valuable insights into market behaviour.
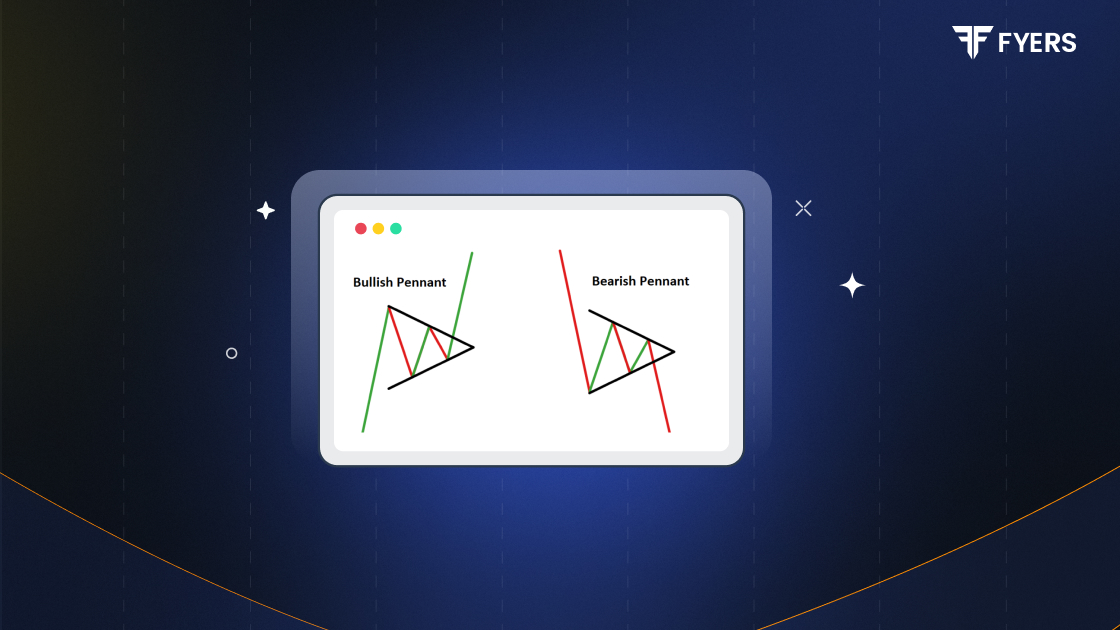
There are two types of pennant chart pattern formations. They represent the bullish pennant pattern and the bearish pennant pattern. These patterns are-
A bullish pennant pattern, known as the flagpole, forms after a strong upward price movement. This initial surge in price is accompanied by high trading volume, indicating strong market interest.
After that, the price enters a consolidation phase, moving within two converging trendlines, creating a small, symmetrical triangle or pennant shape. During this phase, trading volume decreases as the market takes a breather. Finally, the price breaks out above the upper trendline with increased volume, signalling a continuation of the upward trend.
A bearish pennant pattern, the flagpole, forms after a significant downward price movement. This initial drop in price is marked by high trading volume, which shows strong selling pressure.
Next, the price consolidates within two converging trendlines, forming a pennant shape as it moves in a narrower range. During this consolidation, trading volume decreases as the market pauses. The pattern is completed when the price breaks below the lower trendline with increased volume, indicating a continuation of the downward trend.
Pennant chart patterns are widely used in technical analysis to make informed portfolio decisions However, traders should also consider a few limitations of pennant chart patterns while using them to ensure they avoid these pitfalls. Here are a few key limitations of pennant chart patterns.
Short Duration: The pattern forms over a short period, making it difficult to spot in time.
Limited to Trending Markets: The pattern is most effective in markets with clear trends and may not work well in sideways or choppy markets.
False Breakouts: Sometimes, the price breaks out of the pennant but quickly reverses, leading to losses.
Requires Confirmation: The pattern needs to be confirmed with volume analysis and other indicators, adding complexity.
Market Volatility: High volatility can distort the pattern, making it less reliable.
Pennant patterns are valuable tools for traders anticipating future price movements based on current market trends. These patterns help traders make informed decisions about potential breakouts and trend continuations.
By thoroughly understanding pennant patterns and correctly interpreting them, traders can enhance their trading strategies and improve their overall success in the markets.
Calculate your Net P&L after deducting all the charges like Tax, Brokerage, etc.
Find your required margin.
Calculate the average price you paid for a stock and determine your total cost.
Estimate your investment growth. Calculate potential returns on one-time investments.
Forecast your investment returns. Understand potential growth with regular contributions.

You have successfully submitted your partnership request form. You will be hearing us soon!