24 Jul, 2025
 4 mins read
Periods of geopolitical tension — wars, sanctions, elections, or trade disruptions — often rattle financial markets. Price discovery becomes challenging as volatility spikes, and traders seek reliable tools to interpret sentiment and make timely decisions. One such tool gaining traction among both retail and institutional traders is option chain analysis.
By decoding patterns from open interest, volume, and strike prices, option chain analysis helps identify key support and resistance levels, especially when traditional indicators lag. This blog explores how traders can use this approach effectively during uncertain times.
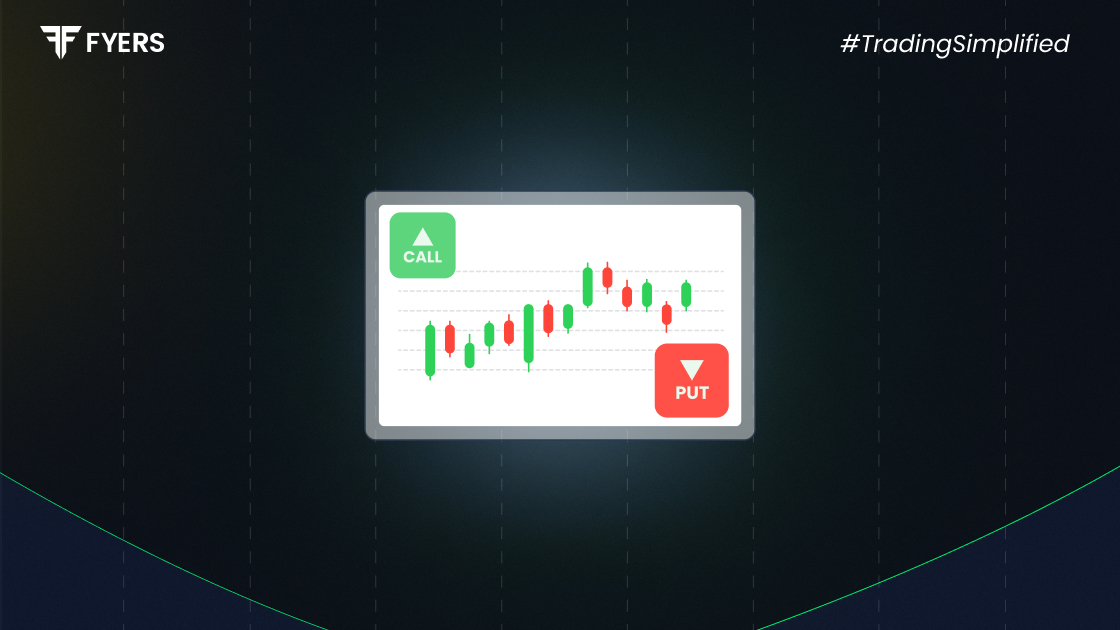
An option chain is a comprehensive table displaying all available option contracts for a specific security — typically equities or indices — at various strike prices and expiry dates. It shows data points like:
Call and put options at each strike
Open interest (OI) and changes in OI
Bid-ask prices and implied volatility
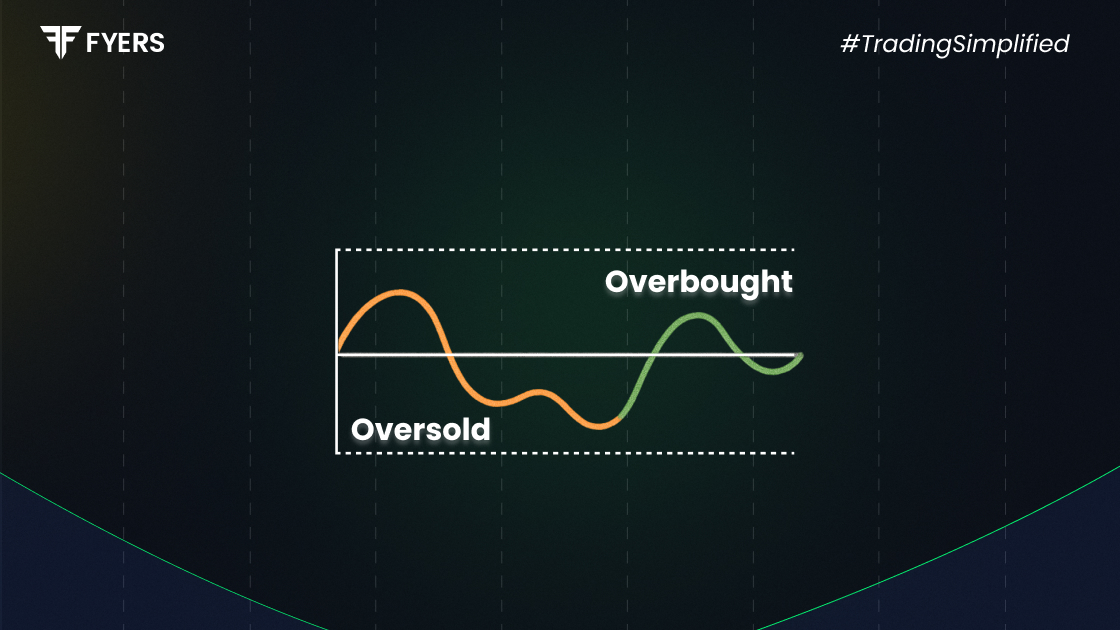
Option chains help traders gauge market sentiment by observing how participants are positioning themselves, particularly around certain price levels.
In stable markets, price levels tend to respect historical support and resistance, and volume indicators work reliably. However, during geopolitical uncertainty, fear and speculation dominate behaviour. This results in sudden price moves, rendering traditional technical analysis less effective.
Option chain analysis becomes valuable here because it:
Captures real-time sentiment shifts
Shows how traders hedge or speculate on outcomes
Highlights price levels with significant interest — likely turning points
For instance, if a large number of traders are buying puts at a specific strike price, it could indicate bearish sentiment or hedging against downside risk.
Here are the primary elements to observe while analysing an option chain:
Open Interest (OI): Indicates how many contracts are currently active. Rising OI at a particular strike level suggests increasing market interest.
Change in OI: Signals a shift in sentiment. A spike in call OI may suggest bullishness, while a rise in put OI could imply bearish expectations.
Volume: Tracks how many contracts changed hands during the day. High volume confirms trader engagement at that level.
Max Pain Point: The strike price at which the option buyers would lose the most. Often, stock prices tend to move closer to this point as expiry nears.
Together, these metrics can help identify likely support and resistance levels, even when the market is highly volatile due to external news flows.
Let’s take the Nifty 50 option chain as an example. Suppose there’s geopolitical tension affecting crude prices and global equities.
In such a situation:
You observe high open interest in Nifty 50 put options at 22,000, suggesting strong support.
Simultaneously, significant call writing at 22,800 indicates resistance.
Traders use this to define a possible range-bound zone between 22,000–22,800.
Any unusual surge in call/put OI may also suggest an impending breakout.
This NSE option chain analysis helps traders react faster to shifts in market structure than relying solely on charts.
While basic analysis involves reading OI and volume, advanced option chain analysis includes:
Put-Call Ratio (PCR): A rising PCR often indicates increasing bearish sentiment.
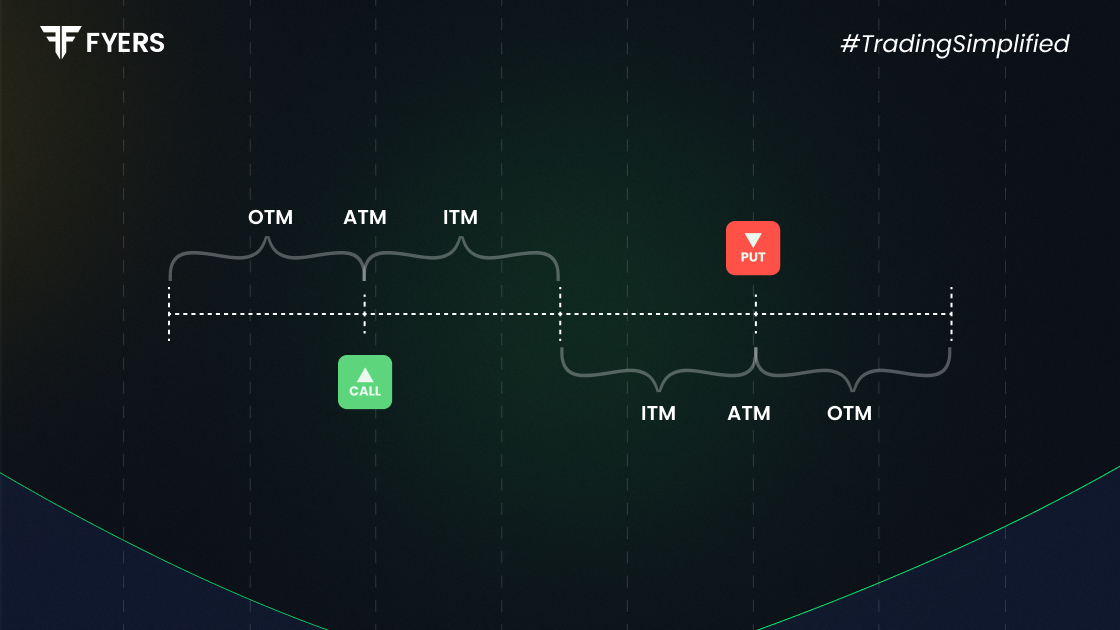
Skew Analysis: Observes differences in implied volatility between OTM (out-of-the-money) puts and calls. During global tensions, put options often become more expensive, reflecting downside hedging.
Strike Buildup Flow: Tracking where fresh positions are being added over time — often using heatmaps or OI overlays.
These advanced techniques are especially useful during crises, such as elections or military escalations, where headlines drive intraday sentiment shifts.
While moving averages, RSI, and MACD remain helpful, they typically lag behind fast-moving events. Option chain offers:
|
Metric |
Technical Indicators |
Option Chain Analysis |
|---|---|---|
|
Response to real-time events |
Often delayed |
Immediate |
|
Indicates market sentiment |
Indirect |
Direct via OI, PCR, and volumes |
|
Predictive ability |
Works well in trends |
Works well in range or volatile moves |
|
Usefulness during uncertainty |
Limited |
High |
As a result, traders often pair both methods — using option chain analysis to identify probable price zones, and technical indicators to time entries or exits.
In times of geopolitical instability, option chain analysis stands out as a powerful decision-making tool. By identifying where traders are positioning themselves, it offers real-time insight into sentiment, risk aversion, and price expectations. Whether you're a short-term trader or long-term investor, incorporating this analysis can help navigate uncertain markets with greater confidence.
With volatility likely to remain a constant in today’s interconnected world, learning to read option chains — especially NSE option chain analysis for indices like Nifty — is no longer optional but essential.
Option chain analysis is the study of options data (like open interest, volume, and price levels) to understand market sentiment and identify key support and resistance zones.
It involves observing call and put positions across various strike prices on the NSE platform to assess where traders expect prices to move.
It includes using tools like the put-call ratio, implied volatility skew, and strike buildup flow to assess sentiment and price direction during high volatility.
During such periods, Nifty option data helps identify investor sentiment, hedging behaviour, and potential reversal or breakout levels, even when news headlines dominate market movement.
Calculate your Net P&L after deducting all the charges like Tax, Brokerage, etc.
Find your required margin.
Calculate the average price you paid for a stock and determine your total cost.
Estimate your investment growth. Calculate potential returns on one-time investments.
Forecast your investment returns. Understand potential growth with regular contributions.

You have successfully submitted your partnership request form. You will be hearing us soon!