21 Jul, 2025
 5 mins read
In the world of swing trading, accuracy in timing entry points can make a significant difference to profitability. One strategy gaining traction among technical traders is the combination of MACD divergence with reversal candlestick patterns. By using these tools together, traders aim to confirm potential trend changes and reduce false signals.
In this blog, we’ll break down why this combined approach works, explore common reversal candlestick patterns, and show how MACD divergence can strengthen their reliability.
The Moving Average Convergence Divergence (MACD) is a popular momentum indicator that shows the relationship between two moving averages of price. Divergence occurs when the price makes a new high or low, but the MACD does not — often indicating a possible trend reversal.
It helps detect weakening momentum.
It can signal early trend reversals.
It filters out noise when used with price action.
Bullish divergence: Price forms lower lows while MACD forms higher lows — a potential sign of a trend shift from bearish to bullish.
Bearish divergence: Price forms higher highs while MACD forms lower highs — signalling a possible move downward.
However, divergence alone is not enough. This is where reversal candlestick patterns come into play.
Candlestick patterns are visual cues on price charts that represent market psychology. Reversal patterns signal a potential change in trend, especially when confirmed by volume and indicators like MACD.
Here are a few key reversal candlestick patterns every swing trader should know:
Occurs when a small red candle is followed by a large green candle that completely “engulfs” the previous one. It suggests a shift in momentum from sellers to buyers.
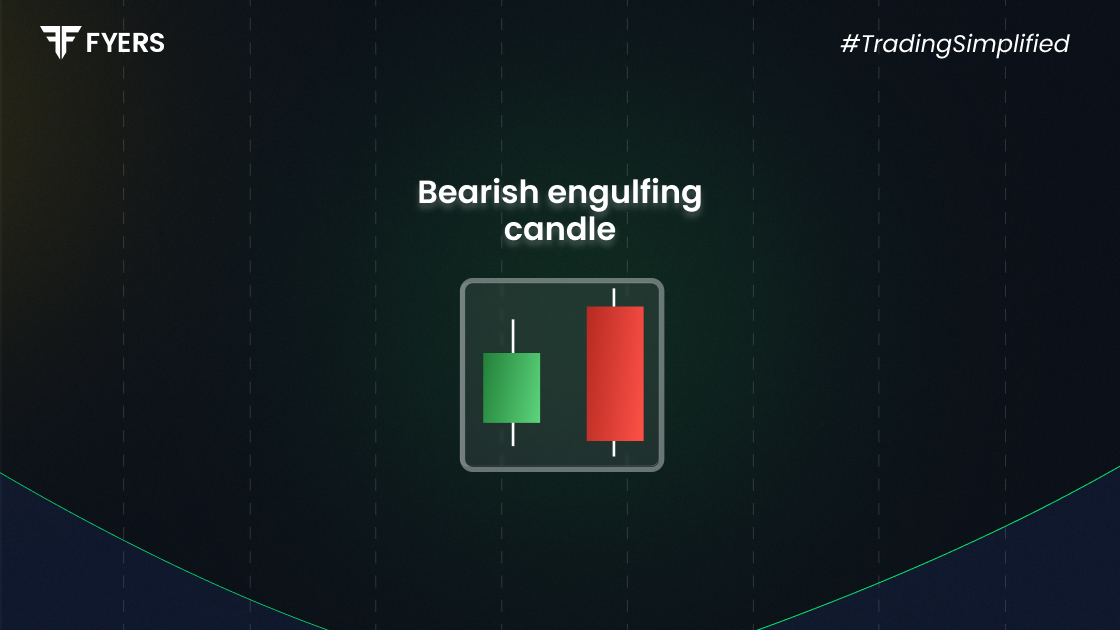
The opposite of the bullish version — a large red candle follows and engulfs a small green one. Often seen at market tops.
A single candle with a small body and a long lower shadow. It indicates that buyers rejected lower prices. Best when found after a downtrend.
Another name for the hammer or its close relative, the inverted hammer, often marks the end of a downtrend when confirmed by other indicators.
These candle patterns trading setups are highly popular due to their simplicity and visual clarity. But on their own, they can sometimes give false signals — especially in choppy markets.
Using MACD divergence to validate a reversal candlestick pattern creates a stronger confirmation of a trend change. Here’s why traders prefer combining both:
Reversal patterns backed by MACD divergence tend to be more reliable. A bullish engulfing pattern supported by bullish MACD divergence increases the chances of a meaningful upward move.
The combination allows for tighter stop-loss placement and better reward potential, as traders enter closer to actual turning points.
MACD helps filter out noise by showing whether the underlying momentum supports the pattern.
To apply this method in real-time trading, here’s a simple step-by-step approach:
Determine if the market is in an uptrend or downtrend. Look for extended moves that may be losing strength.
Check if the price is making higher highs/lower lows while MACD isn’t confirming it.
Confirm with a pattern like hammer, bullish engulfing, or bearish engulfing, depending on the trend.
Higher volume on the reversal candle and proximity to support/resistance levels adds strength to the setup.
Buy/sell after the candle closes. Place a stop-loss below/above the reversal candle.
Set a realistic target based on previous support/resistance or recent price swings.
Let’s look at a common bearish example.
Suppose a stock is trending upward, and you notice the price forming higher highs. However, the MACD histogram or line shows lower highs — classic bearish divergence.
At the top, you spot a bearish engulfing pattern. This combination is a strong signal that buyers may be losing control. A swing trader might short the stock after the bearish engulfing candle closes, with a stop-loss just above its high.
Provides confirmation from both price action and momentum
Reduces reliance on a single signal
Enhances risk management
Works well across multiple timeframes
Not foolproof — divergence can persist for long periods
Requires patience and chart-watching
May give fewer signals, especially in fast-moving markets
Combining MACD divergence with reversal hammer candlestick or engulfing patterns enhances reliability, but traders must still follow disciplined risk management.
Avoid Trading on Small Timeframes Alone
Stick to higher timeframes like 1-hour or daily for stronger signals.
Use Volume as a Secondary Filter
Volume spikes during reversal patterns add further conviction.
Backtest and Forward-Test Your Strategy
Every market behaves differently. Test your approach before using real capital.
Combine with Other Tools
Fibonacci levels, RSI, or moving averages can further improve your edge.
In swing trading, timing is everything. By combining MACD divergence with reversal candlestick patterns, traders can refine their entry points, confirm signals, and manage risk more effectively.
Patterns like bullish engulfing, bearish engulfing, or the classic hammer pattern become much more reliable when backed by a loss of momentum shown by MACD divergence.
Whether you're just starting with candle patterns trading or looking to sharpen your edge, this hybrid method offers a well-balanced, strategy-driven approach to capturing trend reversals in the market.
It’s a two-candle reversal pattern where a green candle fully engulfs the previous red candle, suggesting a potential bullish reversal.
A hammer appears after a downtrend and signals a potential reversal. Its long lower wick shows that buyers pushed prices back up after an early sell-off.
Because divergence validates that momentum is weakening, confirming that the price reversal shown by the candlestick pattern is more likely to succeed.
It’s another term for the hammer candlestick, indicating potential bottoming out in a downtrend, especially when confirmed by momentum indicators like MACD.
Calculate your Net P&L after deducting all the charges like Tax, Brokerage, etc.
Find your required margin.
Calculate the average price you paid for a stock and determine your total cost.
Estimate your investment growth. Calculate potential returns on one-time investments.
Forecast your investment returns. Understand potential growth with regular contributions.

You have successfully submitted your partnership request form. You will be hearing us soon!