17 Jul, 2025
 4 mins read
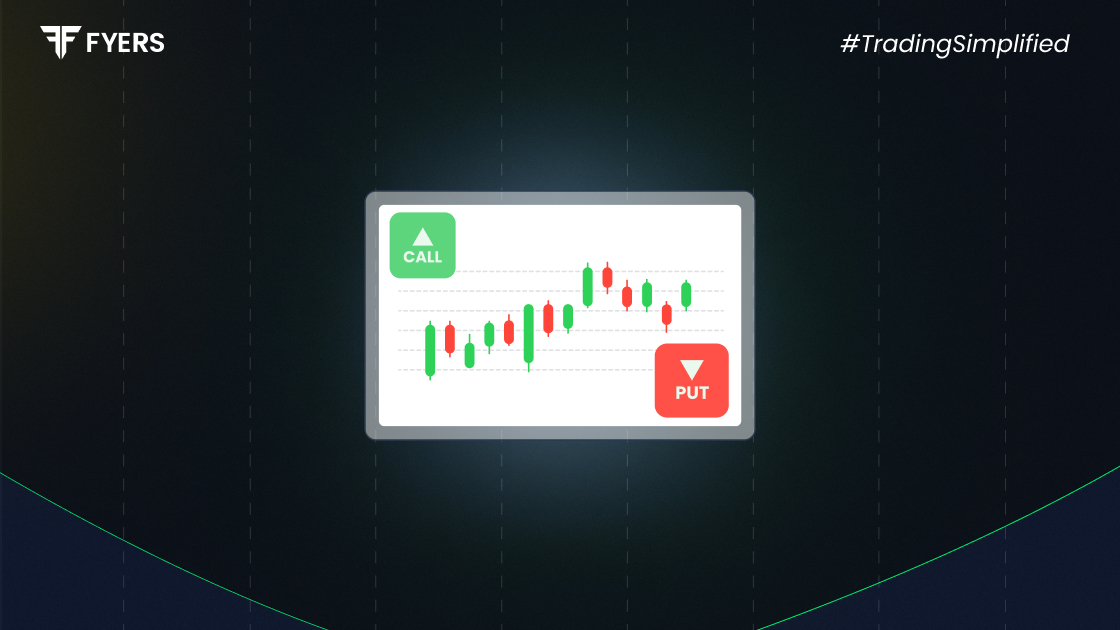
In stock trading, choosing the right technical indicator is crucial—especially in market volatility. Among the many tools traders use, oscillator indicators and trend indicators are two widely adopted types. But when markets become uncertain, which one works better—and why?
Explore how oscillator and trend indicators can guide your decisions in unstable markets and support your broader trading goals.
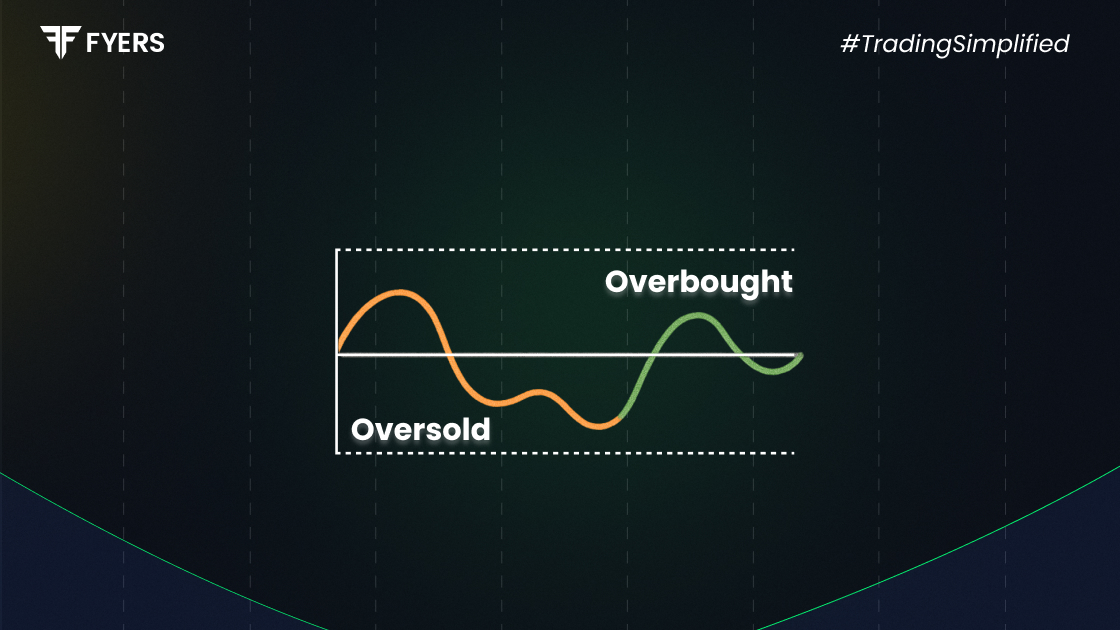
An oscillator indicator helps traders identify potential market turning points using technical tools. Oscillators typically range from 0 to 100 and highlight when a security may be trading too high or too low.
Oscillators highlight shifts in momentum, helping traders decide when to buy and sell. This becomes particularly useful when price action is unclear or lacks a clear trend—something common during market volatility.
In simple terms, when the oscillator reaches an extreme high or low, it suggests the trend may soon reverse. That’s why oscillators are helpful for finding short-term trades in sideways markets, especially for swing traders and those using shorter time frames.
Different types of oscillator indicators use unique methods of calculation and interpretation. Some of the most commonly used in the stock market include:
Relative Strength Index (RSI): Measures the speed and change of price movements. RSI values above 70 typically indicate overbought conditions, while values below 30 suggest oversold territory.
Stochastic Oscillator: Compares a stock's closing price to its price range over a specified period. Especially effective for detecting momentum shifts and short-term reversals.
MACD (Moving Average Convergence Divergence): MACD is a blend of an oscillator and a trend indicator. It shows momentum by comparing two moving averages.
CCI (Commodity Channel Index): Helps identify cyclical trends and extreme market conditions.
Each stock market oscillator serves a unique purpose, but all aim to spot when a security might change direction. These tools are particularly helpful for swing trading vs intraday trading, where timing entries and exits is critical.
While oscillators measure momentum, trend indicators focus on the overall direction of the market. By revealing the market’s direction—up, down, or sideways—these tools help traders build smarter trading strategies.
Moving Averages (Simple and Exponential): Used to smooth out price action and identify the direction of a trend.
Average Directional Index (ADX): Measures the strength of a trend but not its direction.
Parabolic SAR: Helps determine potential entry and exit points based on trend movement.
The key difference between the two lies in how they respond to price changes. Oscillators respond fast and give early signals, while trend indicators take more time but confirm the trend’s direction. That’s why traders often use trend indicators for long-term trades and oscillators for multiple trades on shorter time frames.
Market volatility can quickly shift direction, making it harder for traders to rely solely on trend-following strategies. In such conditions, oscillator indicators often offer a distinct advantage.
Oscillators respond to sudden price changes more rapidly than trend indicators. During sharp price drops and quick recoveries before market close, RSI and Stochastic Oscillators often alert traders to reversals before moving averages do.
Trend indicators can still be useful in volatile markets, but they work best when the trend is clear and steady. For sideways markets, oscillators improve the accuracy of short-term trade entries and exits, essential for both day trading and swing trading vs day trading.
That said, many experienced traders prefer to combine both tools. To manage risk and reduce margin requirements, traders often confirm oscillator reversal signals with trend indicators before entering trades.
Like any tool for studying markets, stock market oscillators have their own strengths and limitations. Here’s a quick overview:
Early Signals: Oscillators can identify overbought or oversold conditions before a trend is visible.
Useful in Sideways Markets: They work well when price action lacks direction—helpful for swing traders.
Simple to Use: Many oscillators come with clear thresholds and easy-to-read signals on most trading platforms.
False Signals in Trending Markets: In strong trends, oscillators may give premature reversal signals.
Lag During Breakouts: Oscillators may miss or fail to confirm sustained momentum.
Need for Context: Without support from other indicators or analysing the market, oscillator signals may lead to incorrect decisions.
To get the most from oscillators, it’s important to use them with other tools, which helps across different time frames and trading styles such as swing trading.
Both oscillator indicators and trend indicators have their place in a trader’s toolkit. In volatile markets, oscillators often shine by offering quick insights into potential reversals. Their signals for overbought or oversold levels give traders a valuable edge when price action becomes uncertain.
However, no single indicator works best in every situation. The key lies in knowing when and how to use each tool effectively. For short-term trades or range-bound markets, oscillators like RSI or Stochastic can be invaluable. For long-term positions or trend confirmation, moving averages and ADX may offer higher profit potential.
The most effective approach often blends momentum and trend tools, supported by solid risk management. Since trading involves constant decision-making, the right mix of indicators can make all the difference.
Oscillator indicators measure market momentum and signal when an asset may be overbought or oversold.
Common types of oscillator indicators include RSI, Stochastic Oscillator, and MACD.
Yes, but they’re most effective when combined with trend indicators or volume analysis to avoid false signals.
During sideways or choppy markets, oscillator indicators help spot potential reversals and avoid chasing false trends.
Calculate your Net P&L after deducting all the charges like Tax, Brokerage, etc.
Find your required margin.
Calculate the average price you paid for a stock and determine your total cost.
Estimate your investment growth. Calculate potential returns on one-time investments.
Forecast your investment returns. Understand potential growth with regular contributions.

You have successfully submitted your partnership request form. You will be hearing us soon!