17 Jul, 2025
 5 mins read
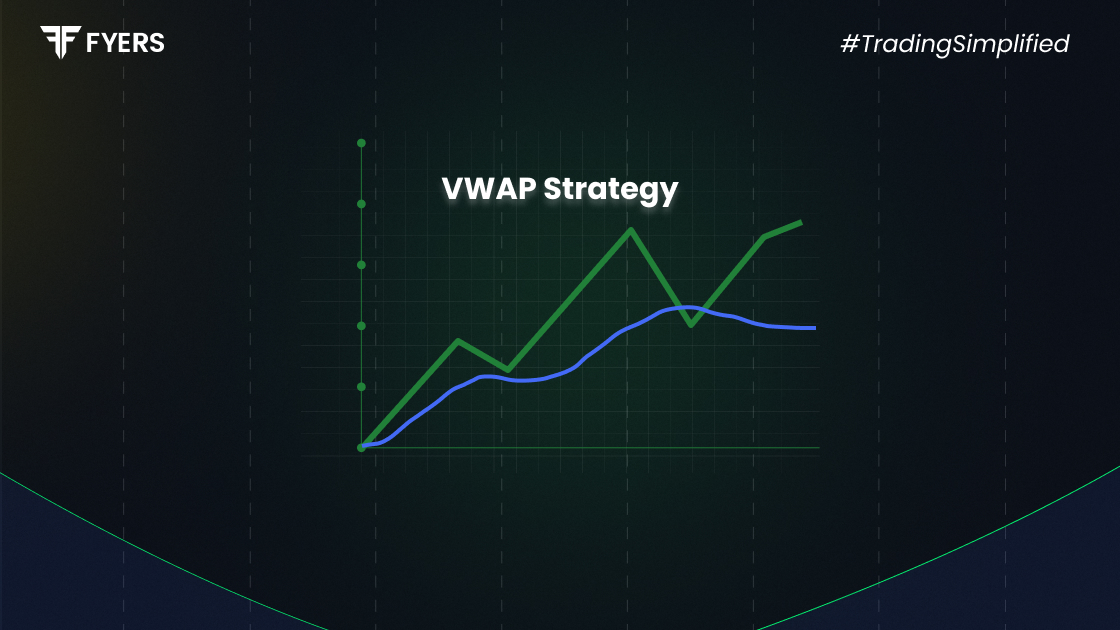
Intraday trading demands sharp decision-making, precise timing, and a solid understanding of price behaviour. Among the many tools used by day traders, the VWAP strategy stands out for its ability to offer both clarity and confidence during fast-moving sessions.
In this guide, we’ll explore the VWAP indicator, how it works in the stock market, and how to create a profitable VWAP trading strategy tailored for intraday use.
VWAP stands for Volume Weighted Average Price. It’s a technical indicator used to calculate the average price a stock has traded at throughout the day, based on both price and volume.
Unlike a simple moving average, which considers only price over a specific time period, VWAP incorporates traded volume, making it more reflective of market consensus.
In essence, the VWAP indicator helps traders understand whether the price is trading above or below its average level, giving them insights into market sentiment and positioning.
In the stock market, VWAP is typically calculated from the opening bell until market close. The formula for VWAP is:
VWAP = (Cumulative Price × Volume) / Cumulative Volume
This calculation resets daily and is displayed as a line on intraday charts, often used on 1-minute to 15-minute intervals.
Key Interpretations:
Price above VWAP suggests buying pressure or bullish sentiment.
Price below VWAP indicates selling pressure or bearish sentiment.
Institutions and professional traders often use VWAP to ensure they’re getting fair pricing during large orders without pushing the market too far.
Before designing your own VWAP strategy, it’s important to understand how traders use VWAP in different contexts:
If the stock remains above VWAP with higher highs, it’s considered a strong uptrend. Traders may enter long positions when price pulls back to VWAP and bounces.
If a stock moves too far from VWAP, some traders expect a reversion. This setup is often used when markets are range-bound or lack direction.
VWAP can act as a dynamic support or resistance line. A break above VWAP could signal a bullish move, while a break below might confirm a bearish shift.
These principles form the foundation of most VWAP trading strategies used by intraday traders.
Creating a volume weighted average price strategy starts with defining your trading style and risk tolerance. Here’s a simple framework:
VWAP is best used on intraday charts, such as 1-minute, 5-minute, or 15-minute timeframes.
Look for setups where:
Price pulls back to VWAP in an uptrend and shows signs of reversal (bullish engulfing candle, higher low).
Price rallies into VWAP in a downtrend and then rejects it (bearish signal).
Volume spikes near VWAP can offer confirmation. A strong move with high volume from the VWAP line often indicates a reliable signal.
Place your stop-loss slightly below the VWAP (for long trades) or above it (for shorts).
Use recent price levels or a risk-reward ratio of at least 1:2 for your target.
Backtest the strategy across different stocks and market conditions. This helps refine your approach before risking real capital.
The default VWAP resets daily and is used mainly for intraday trading. However, some platforms offer advanced VWAP indicator settings like:
Anchored VWAP: Allows traders to start VWAP calculation from any chosen point — useful for earnings releases, breakouts, or gap openings.
Multiple VWAP lines: You can layer in VWAPs from different time frames (e.g., weekly VWAP alongside intraday) to see broader context.
Custom volume filters: Use volume thresholds to eliminate low-liquidity periods or false signals.
Combine VWAP with price action and candlestick patterns to improve accuracy.
Avoid trading solely on VWAP crossovers — use context and confluence.
Don’t force trades when the price is consolidating near VWAP with no clear direction.
Widely Used by Institutions: Helps align your trades with the ‘smart money.’
Real-Time Price Benchmarking: Reflects where the majority of volume is trading.
Adapts to Market Conditions: Useful in trending and range-bound setups.
Intraday Only: Daily VWAP resets, making it less effective for swing or long-term positions.
Lagging Nature: VWAP uses average data, so it may lag during rapid price spikes.
False Signals: Without confirmation, traders may misinterpret VWAP bounces or breaks.
Understanding these advantages and limitations can help you apply VWAP with better discipline and judgement.
Let’s look at how VWAP plays out in real trading scenarios:
Stock opens strong and rallies above VWAP.
Price retraces midday and tests VWAP with declining volume.
A bullish candle confirms the bounce.
Trader enters long, targets previous high.
Price stays below VWAP all morning.
A midday rally touches VWAP but fails to break through.
A bearish engulfing candle appears with high volume.
Trader enters short, targets session low.
These examples show how VWAP in stock market trading can offer practical signals when combined with broader context and timing.
The VWAP strategy remains a popular and effective approach for intraday traders seeking clarity and consistency. By combining price and volume into a single dynamic benchmark, the VWAP indicator gives traders a reliable edge in decision-making.
However, like any strategy, success lies in how you apply it — not just in recognising VWAP lines, but in understanding market context, managing risk, and staying disciplined.
If you’re aiming to build a profitable volume weighted average price strategy, start simple, test thoroughly, and gradually incorporate advanced tools like anchored VWAP or custom filters.
VWAP stands for Volume Weighted Average Price. It calculates the average trading price of a stock based on both volume and price during the trading session.
Start with a chart-based VWAP indicator, identify patterns like bounces or rejections, confirm with volume, and manage trades using stops and targets.
The default daily VWAP works well for intraday trading. You can use anchored VWAP or multi-timeframe VWAPs for advanced strategies.
Yes, VWAP is widely used by institutional and retail intraday traders due to its real-time reflection of market sentiment and volume-weighted price levels.
Calculate your Net P&L after deducting all the charges like Tax, Brokerage, etc.
Find your required margin.
Calculate the average price you paid for a stock and determine your total cost.
Estimate your investment growth. Calculate potential returns on one-time investments.
Forecast your investment returns. Understand potential growth with regular contributions.

You have successfully submitted your partnership request form. You will be hearing us soon!