22 Jul, 2025
 5 mins read
Technical traders often rely on price patterns to anticipate potential market moves. Among the more reliable reversal formations is the triple bottom pattern, a classic signal that a downtrend may be ending. But even dependable patterns can produce false signals without proper confirmation.
By combining volume divergence with AI-driven trade signals, modern traders can significantly improve the accuracy of their trades around the triple bottom chart pattern.
In this guide, we’ll explore how to identify this pattern, why volume matters, and how artificial intelligence tools can provide a new layer of confidence in your decision-making process.
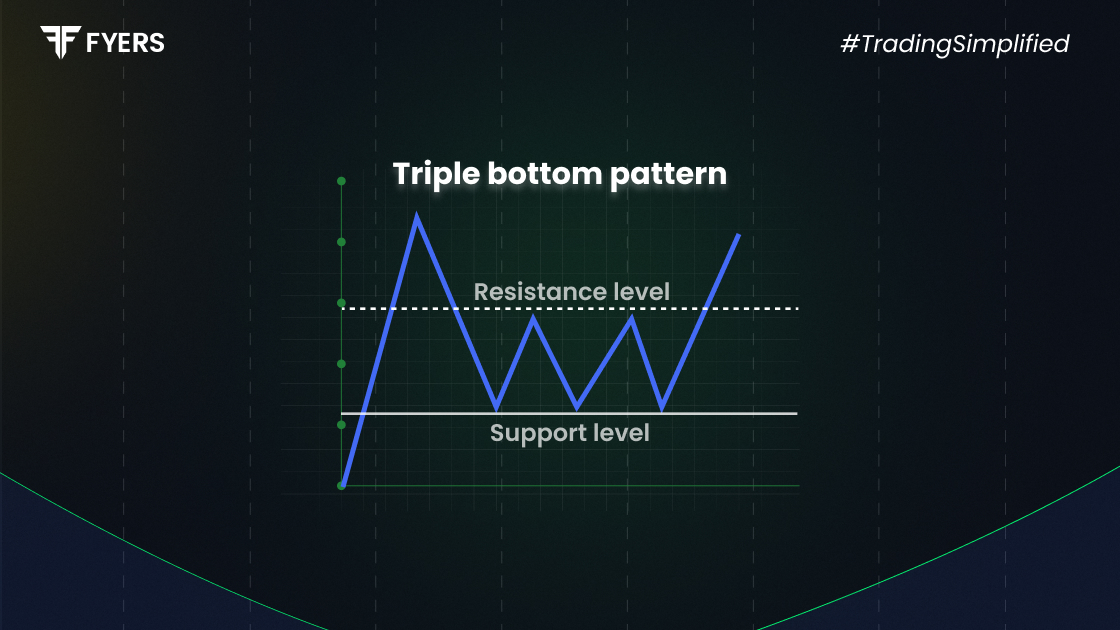
The triple bottom pattern is a bullish reversal chart pattern that typically forms after a prolonged downtrend. It consists of three distinct lows that touch roughly the same price level, separated by two minor rallies.
The pattern indicates that selling pressure is weakening and buyers are gradually gaining control. When the price finally breaks above the resistance level formed by the two intermediate highs (known as the neckline), it signals a potential trend reversal.
Three lows near the same price level
Horizontal or slightly upward neckline
Increase in volume on the breakout
Formed over a significant timeframe (often weeks)
Recognising the triple bottom candlestick pattern requires more than just spotting three dips. Traders need to ensure:
The pattern occurs after a downtrend
Each bottom shows declining selling volume
The neckline acts as a clear resistance zone
A confirmed breakout occurs with increased volume
Here’s how to read the structure:
First bottom: Often forms after a strong decline and signals initial support.
Second bottom: Price retests support, showing the first hint of demand.
Third bottom: Confirms that sellers are unable to break below support.
Candlestick behaviour near these bottoms — such as long lower wicks, bullish engulfing candles, or doji formations — can provide early signs of reversal.
One of the most powerful confirmations in triple bottom trading comes from volume divergence.
Volume divergence occurs when the price continues to test support levels but volume declines with each attempt. This suggests that selling momentum is fading, even though the price appears weak.
It shows that fewer participants are willing to sell at lower levels
It hints at accumulation by stronger hands
It often precedes a breakout as demand overtakes supply
When combined with price action, volume divergence makes the breakout from a triple bottom stock pattern more reliable and tradable.
Tip: Always look for a volume spike on the breakout — this confirms strong buying interest and improves breakout credibility.
With growing advancements in trading technology, AI signals are becoming a valuable tool for pattern recognition and trade confirmation.
Modern AI-based trading platforms can:
Scan thousands of charts in real-time to detect triple bottom chart patterns
Measure volume behaviour, trend strength, and market context automatically
Trigger alerts based on multiple conditions (e.g., pattern + divergence + RSI oversold)
Avoid emotional bias that often affects human pattern recognition
An AI-enhanced approach can help:
Reduce false breakouts by filtering weak setups
Save time by pre-identifying high-probability patterns
Assist novice traders in spotting patterns with more consistency
While AI tools should not replace trader judgement, they provide a valuable layer of objective analysis, especially when validating complex setups like a triple bottom.
Here’s a structured approach to trading a triple bottom pattern, combining volume and AI signals:
Use a charting tool or AI scanner to identify a potential triple bottom
Confirm the pattern follows a clear downtrend
Check if volume declines at each successive low
Look for reduced selling pressure and signs of accumulation
Wait for a breakout above the neckline
Look for a volume surge as confirmation
Enter the trade on breakout or retest of the neckline
Use a confirmation signal, such as bullish RSI or MACD crossover
Place stop-loss slightly below the third bottom for protection
Keep risk within 1–2% of capital
Measure the height of the pattern (neckline to bottom)
Project the same distance upward from the breakout point
Consider scaling out at key resistance levels
By following this plan, you reduce emotional decisions and increase consistency in trading the triple bottom trading setup.
Even though the triple bottom pattern is reliable, traders often make mistakes that can reduce their success rate.
Jumping in before a breakout above the neckline can result in losses if the pattern fails.
Neglecting volume behaviour can lead you to trade false breakouts. Always check for declining volume at lows and rising volume on breakouts.
Three random lows don’t make a triple bottom. Ensure the pattern follows a sustained downtrend and forms over a meaningful period.
AI tools are great for screening and validation, but don’t trade solely on signals. Use your own analysis to support each setup.
The triple bottom pattern offers a dependable signal for trend reversal, especially when supported by clear volume dynamics. Adding volume divergence to your analysis filters out weak setups and improves breakout accuracy.
Furthermore, incorporating AI signals can help traders save time, reduce emotional bias, and confirm valid trading opportunities — particularly useful for those managing multiple charts or new to technical analysis.
When used together, these tools empower traders to approach triple bottom trading with more structure, discipline, and confidence.
Like all strategies, success lies in preparation, proper risk management, and continued learning. The more effort you put into recognising the pattern and validating it through multiple confirmations, the better your results will be.
It’s a bullish reversal pattern formed by three equal lows, indicating strong support and a potential trend reversal when the price breaks above resistance.
Declining volume at each bottom signals weakening selling pressure. A volume spike on breakout confirms strong buyer interest.
Yes, AI tools can scan multiple charts, identify patterns, measure volume, and generate alerts when all criteria are met — improving trade accuracy.
The typical target is equal to the height of the pattern (from the bottom to neckline), projected upwards from the breakout level.
Calculate your Net P&L after deducting all the charges like Tax, Brokerage, etc.
Find your required margin.
Calculate the average price you paid for a stock and determine your total cost.
Estimate your investment growth. Calculate potential returns on one-time investments.
Forecast your investment returns. Understand potential growth with regular contributions.
Whether you're buying a house, a car, or the latest…
30 Jun, 2025
4 mins read
Many people dream of becoming rich, but wealth isn't just…
30 Jun, 2025
3 mins read

You have successfully submitted your partnership request form. You will be hearing us soon!