
 4 Jul, 2025
 3 mins read

Understanding how efficiently a company uses its assets is key to analysing its operational performance. One of the most widely used financial metrics to assess this is the Asset Turnover Ratio. It reflects how well a company is generating revenue from its assets and is particularly useful in comparing businesses across sectors.
In this blog, we’ll break down what the asset turnover ratio is, how to calculate it, provide practical examples, and explore its interpretation and limitations.
Asset turnover ratio is a financial metric that measures a company’s efficiency in using its assets to generate sales revenue. It indicates how many rupees of revenue a company generates for every rupee invested in assets.
In simple terms, high asset turnover means the company is using its assets effectively to produce revenue, while a low ratio may indicate inefficiencies or underutilisation. This ratio is especially relevant in asset-heavy sectors like manufacturing, infrastructure, or retail.
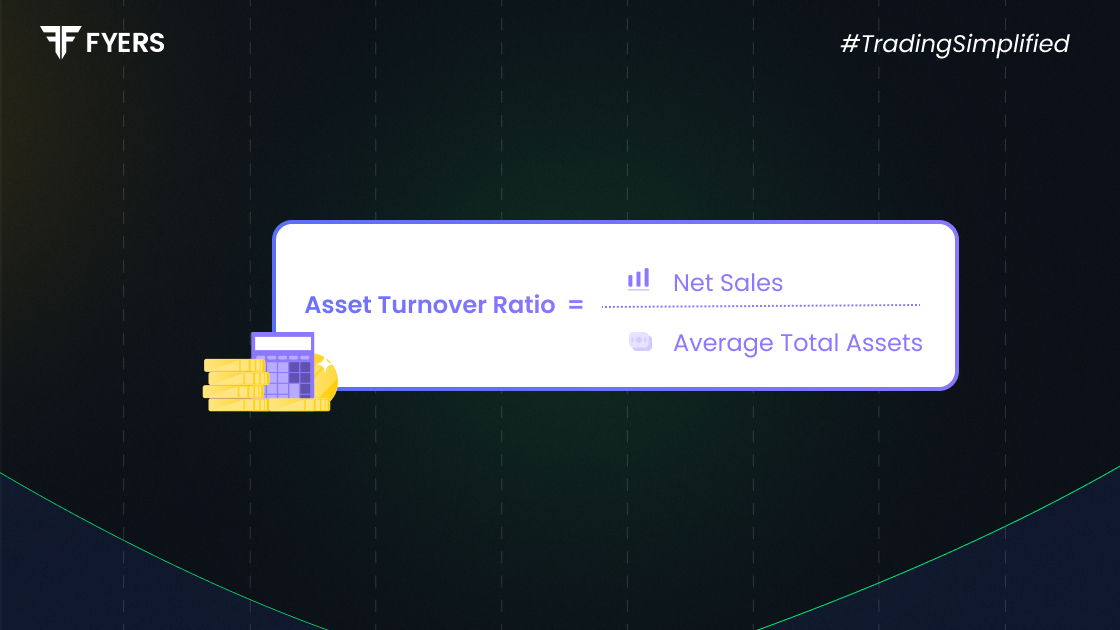
Asset Turnover Ratio Formula:
| Asset Turnover Ratio = Net Sales ÷ Average Total Assets |
Where:
Net Sales = Revenue from operations (excluding returns, discounts, and taxes)
Average Total Assets = (Opening Total Assets + Closing Total Assets) / 2
Asset Turnover Ratio Calculation Example:
Let’s say a company has:
Net Sales = ₹80,00,000
Opening Total Assets = ₹30,00,000
Closing Total Assets = ₹50,00,000
Then:
Average Total Assets = (30,00,000 + 50,00,000) / 2 = ₹40,00,000
Asset Turnover Ratio = ₹80,00,000 / ₹40,00,000 = 2.0
This means the company generates ₹2 in revenue for every ₹1 invested in assets.
What Is a Good Asset Turnover Ratio?
It depends on the sector:
Retail companies or FMCG firms often have high asset turnover ratios (2.0 or more) due to high sales volume and relatively low asset base.
Capital-intensive businesses (e.g., manufacturing or utilities) may have a lower asset turnover ratio (around 0.5) due to heavy investment in fixed assets.
Key Takeaways:
Use industry benchmarks to assess performance.
Compare trends over multiple periods for meaningful insights.
A higher ratio is not always better - combine with margin analysis for deeper interpretation.
For investors and analysts, this ratio is a tool to:
Measure operational efficiency
Assess management effectiveness
Compare peer performance in the same sector
Spot trends that may indicate growth or inefficiency
Many combine the asset turnover ratio with return on assets (ROA) or return on equity (ROE) to get a full picture of a firm’s profitability and efficiency.
Example 1 - Retail Business:
Net Sales = ₹1,00,00,000
Average Total Assets = ₹25,00,000
Asset Turnover Ratio = ₹1,00,00,000 / ₹25,00,000 = 4.0
This high ratio reflects strong efficiency, typical for high-volume, low-margin industries.
Example 2 - Manufacturing Company:
Net Sales = ₹50,00,000
Average Total Assets = ₹1,00,00,000
Asset Turnover Ratio = ₹50,00,000 / ₹1,00,00,000 = 0.5
A low ratio, but acceptable due to the capital-intensive nature of the industry.
Helps gauge how well a company uses its assets to generate sales
Useful for credit and investment analysis
Indicates whether a company is under-utilising or optimising its assets
A valuable input when conducting comparative analysis in asset-heavy sectors
Despite its usefulness, this ratio has a few shortcomings:
Ignores profitability: Focuses on sales, not profits or cost structure
Industry dependency: Not suitable for cross-sector comparisons
Influenced by accounting methods: Asset valuation and depreciation can vary
Asset age: Older depreciated assets may inflate the ratio artificially
Seasonality impact: Companies with seasonal sales may show skewed ratios
Always pair the asset turnover ratio with other metrics like net profit margin, cash flow, and debt ratios for a complete evaluation.
The asset turnover ratio is a crucial efficiency metric for analysts, investors, and business owners. It helps understand how effectively a company is leveraging its assets to drive revenue. However, it should never be used in isolation. For a balanced analysis, consider the profitability, asset quality, and industry context alongside this ratio.
It measures how efficiently a company generates sales from its assets. For example, a ratio of 2.0 means ₹2 in sales for every ₹1 in assets.
Use the formula:
Asset Turnover Ratio = Net Sales ÷ Average Total Assets
It shows how well management is using company assets to drive revenue. A higher ratio typically means better efficiency.
No, because both sales and assets are typically positive figures. However, a very low ratio may indicate poor performance.
Calculate your Net P&L after deducting all the charges like Tax, Brokerage, etc.
Find your required margin.
Calculate the average price you paid for a stock and determine your total cost.
Estimate your investment growth. Calculate potential returns on one-time investments.
Forecast your investment returns. Understand potential growth with regular contributions.